|
A scale model of our galaxy emphasizes how huge it is relative to solar system
scales. With our galaxy as continental size, the solar system is a few inches
across, the sun is 10 micron human cell, and the Earth is a 100 nm virus 2mm from the
sun. The galaxy comprises a hundred billion human cells (your hand) spread across
the US and up hundreds of km into the sky -- typical star-star separations are ~200m in
the disk, ~1m in the nucleus. The naked-eye stars lie within a few tens of miles of
the sun. The galactic rotation gives the solar system a ground speed of ~10 cm per
year -- 200 Myr to circumnavigate the continent, which is roughly continental drift
rate.
The diagram locates the sun and three well known Messier objects in roughly the right
locations -- the Crab nebula is ??m across; the Eagle nebula ??m and the Jewel Box
cluster is ??m
.
|
|
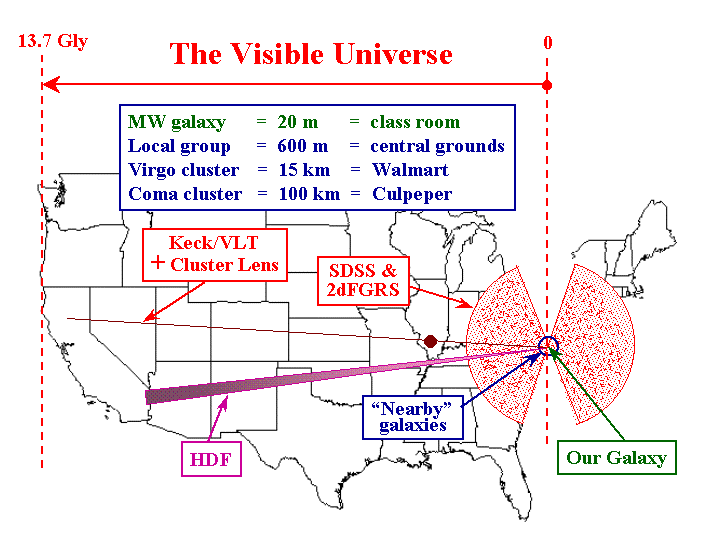
Changing scales, we now represent the visible (14 Gly radius) Universe as continent
sized, with the MW galaxy on one side. On this scale, the MW is roughly class-room
sized (20m) and local group galaxies are within 500m. All galaxies for which we have
"pretty pictures" (eg Messier galaxies), are within a few tens of miles (the galactic
neighborhood), and the Coma cluster is 100 km distant. Perhaps surprisingly, the
major redshift surveys (eg 2DFGRS or SDSS) span the neaby states, reaching 20% to the
"edge" (using look-back time as distance measure here).
The Hubble Deep Field surveys a tiny region out to redshifts ~3, while the most
distant galaxies are seen through the gravitational lenses of "nearby" rich clusters.
|

