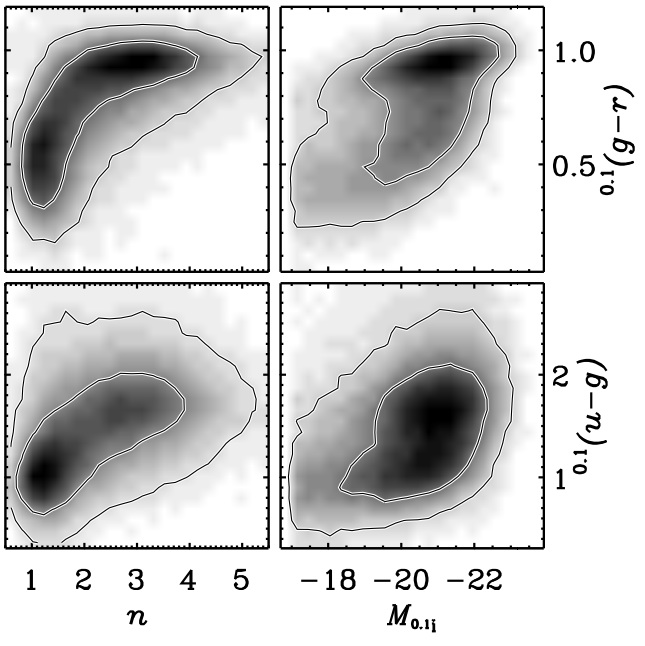
Top left shows how blue galaxies are almost all exponential disks (n=1), while red galaxies can have a range of Sersic n, though they tend to be higher. First three images from Blanton et al 2003 ApJ 594 186 o-link

Top left panel shows how galaxy luminosity (vertical axis) and Sersic n parameter are related. Low luminosity galaxies tend all to be disks, while at higher luminosity, there can be a range of profiles.
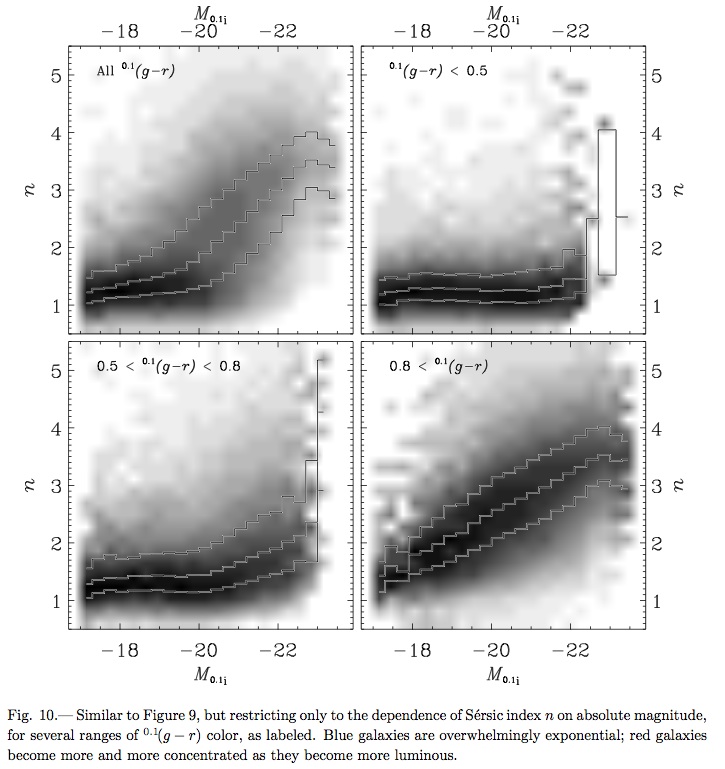
Top right are blue galaxies, lower right are red galaxies. Clearly, blue galaxies are exponential disks at all luminosity, while red galaxies can be disks at low luminosity but become bulge dominated (or elliptical) at higher luminosity.
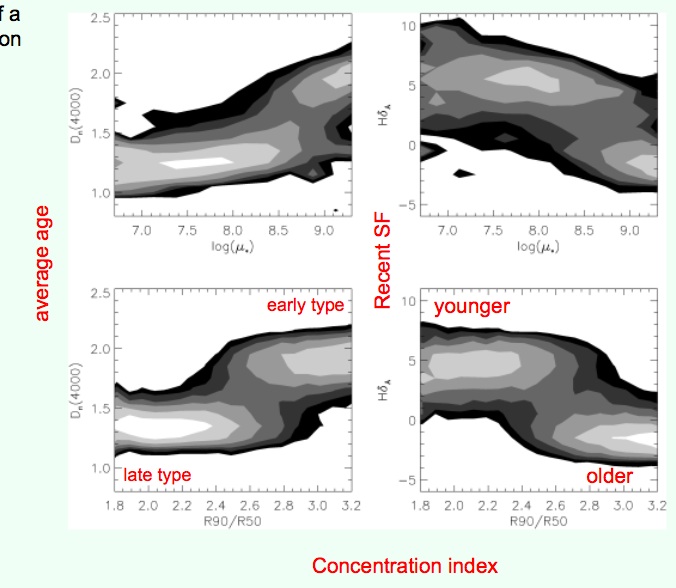
Lower two plot concentration (R90/R50) against the two population age measures H and D4000 (high H and low D4000 track young populations. Upper two give the same age relations but for mean surface mass densities (M
 /kpc2). Figure taken from Kauffmann et al 2003 MN 341 54 o-link