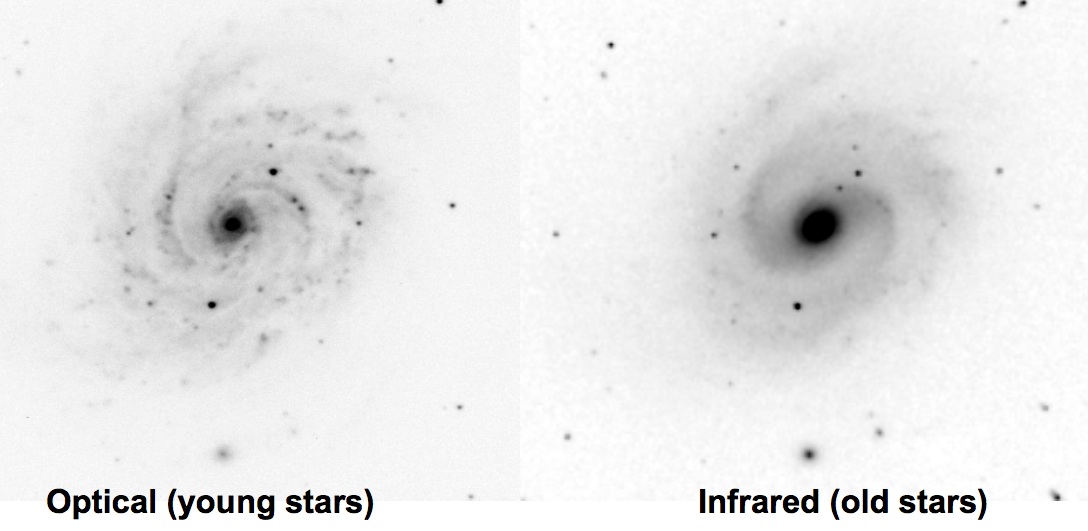
NGC 5085 images in blue (left) showing primarily the regions of star formation. In the IR (right) the spiral arms are also visible. Grand design spiral arms also show spiral patterns in the underlying mass distribution.

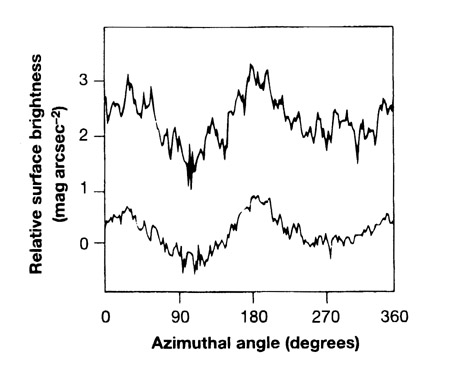
Arm/Interarm contrasts (A = 0.4 x 10
 m), where
  m
is the magnitude difference, for B (top) and I (bottom) colors.

A plot of the ratio of arm contrasts in B and I versus the arm contrast in I. This separates the different arm classes of galaxy quite well.
(From Elmergreen text: Galaxies & Galaxy Structure).