
Optical and HI images of M33 (left and center) On the right is illustrated the Doppler velocities of the HI, color coded for redshift and blueshift. Spider diagrams are simply the contours of this color representation.
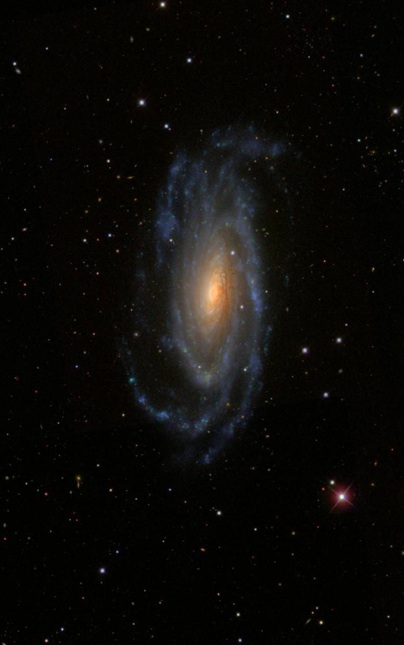
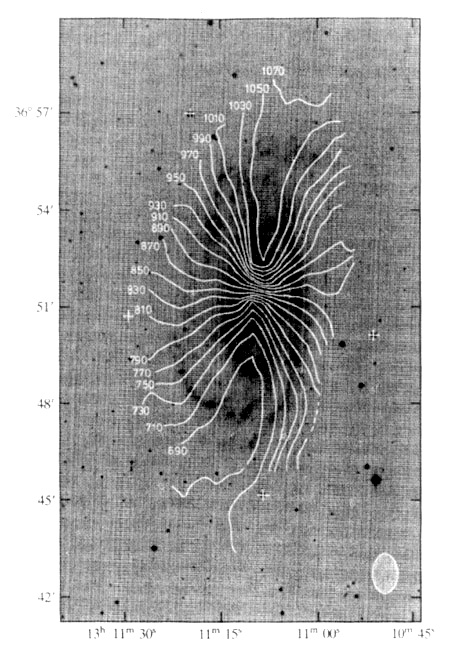
SDSS image of the inclined Sc galaxy NGC 5033. On the right, at the same scale, is the 21cm HI spider diagram, with classic form for inclined circular disk rotation, with flat approximately rotation curve.