
Sersic profiles with index n = 1 to 10, plotted as magnitudes (w.r.t. µe) and log radius (w.r.t. Re). Note that while low-n profiles are shallower inside Re they are steeper outside Re, so the n-index isn't describing the overall steepness of the profile. Instead, the n-index specifies the change in steepness between inside and outside Re. This is equivalent to specifying the concentration of the light (see below).
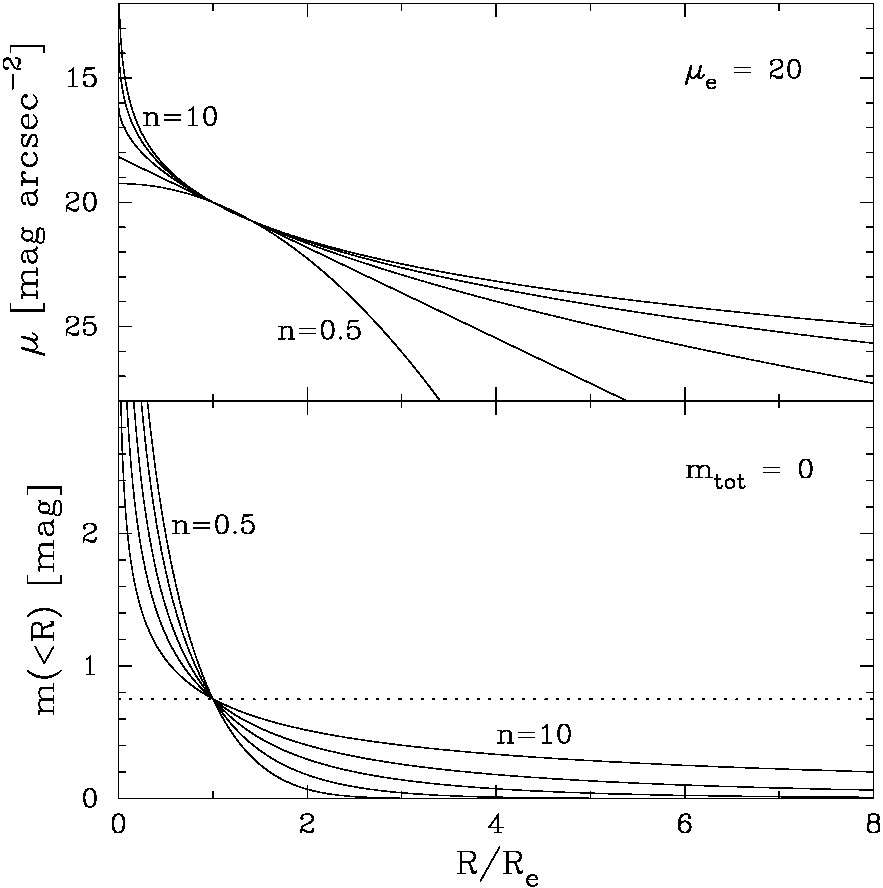
Sersic profiles with index n = 0.5, 1, 2, 4, 10, plotted against linear radius (w.r.t. Re). Below is the integrated (aperture) magnitude plot, with the dotted line for 50% of the flux (~0.75 mag). Note the 90% flux line would be at ~0.11 mag, so the concentration index R90/R50 is significantly greater for high n profiles (e.g. n=4 has R90/R50 ~ 6, while n=1 has R90/R50 ~ 2.5). [Figure 1 from Graham & Driver 2005 o-link].

Different measures of concentration for different Sersic n-index. Clearly, the Sersic n-index primarily measures concentration. [Figure 2 from Graham & Driver 2005 o-link]