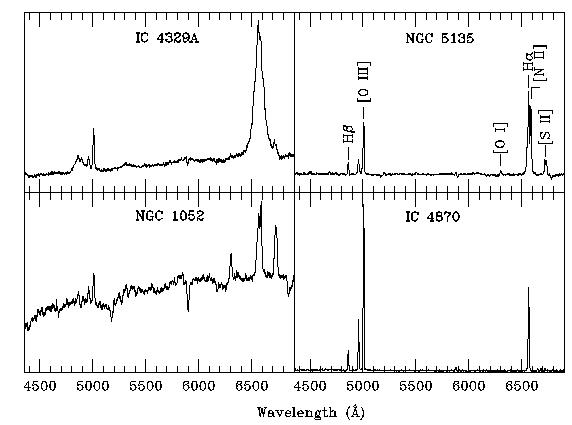
Spectra from various types of AGN. In addition to the relative strength of the broad and narrow lines, the classification also uses the relative strengths of just the narrow lines.

Emission Line Diagnostics (BPT & VO diagrams) |
|
Spectra from various types of AGN. In addition to the relative strength of the broad and narrow lines, the classification also uses the relative strengths of just the narrow lines.
|
|
|
|
|
|
Examples from the later paper by Veilleux and Osterbrock. Notice how the different types of ionized region inhabit different parts of the diagram -- mainly because the gas is ionized by different kinds of spectrum. These ratios tend to be preferred the the BPT ratios (see below) because they make use of lines close in wavelength, and therefore relatively insensitive to uncertainties in reddening.
|
|
|
|
|
| The earlier paper by Baldwin Phillips and Terlevich made particular use of [OII]3727/[OIII]5007. Unfortuately, since these lines are quite far apart in wavelength, this ratio is rather sensitive to uncertainties in reddening. In these diagrams, open circles = HII regions; diamonds = Seyferts; crosses = LINERs; plusses (or bars) = planetary nebulae. | |