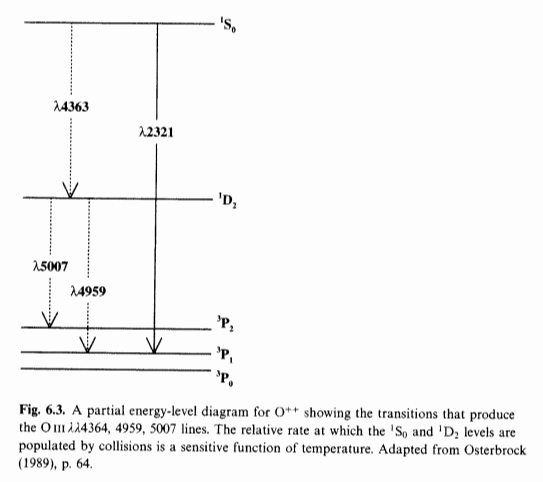
Simplified energy level diagram for the O++ ion. Note that the 5007 and 4959 lines come from the same upper level, so their flux ratio reflects simply the statistical weights of the two lower levels, which is 3:1. Hence their ratio is always fixed at 3:1.

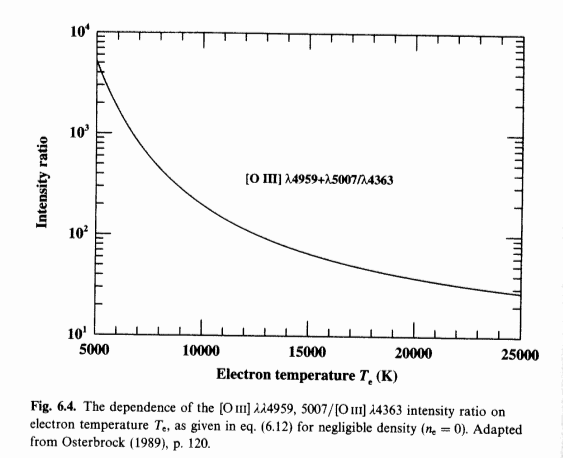
Variation of the [OIII] 4959+5007 / 4363 line ratio with temperature (in the limit density = 0).
Figures from Peterson's AGN book (via Osterbrock's book).