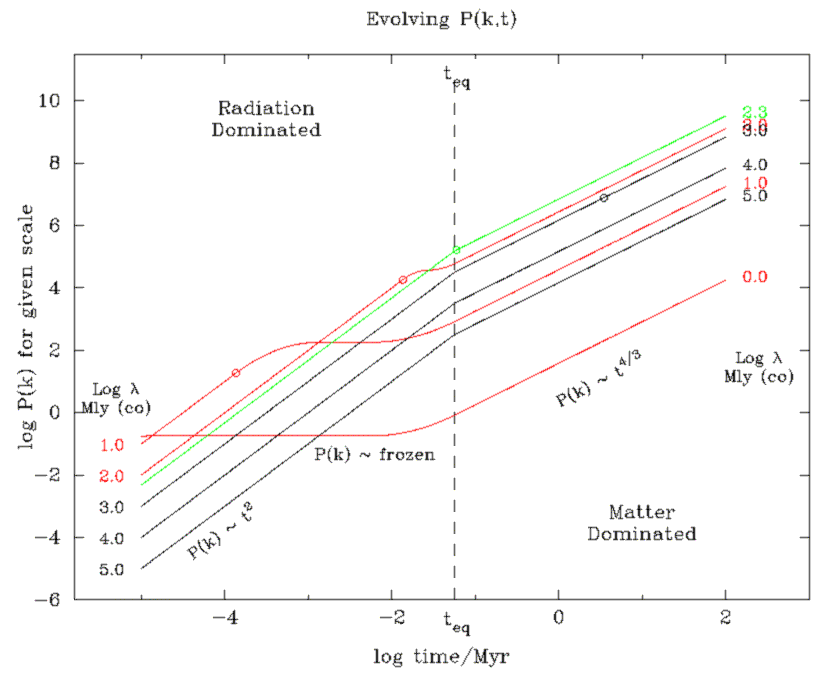
The following figures were made using a rough model:
- Hubble radius, rH, is set to ct at all times (rather than 2ct and 3ct/2
in the radiation and matter eras).
- We simply set k = 1/
 (instead of 2
 /
/ ) with all lengths in Mly.
- Simple dynamics: a ~ t½ and t2/3 in the radiation
and matter eras, with a sudden change at teq = 0.057 Myr; zeq = 3700.
- The slow growth of

 /
/ during the radiation era is initially set to zero (refined model
modifies this).
- No other influences (early or late) on P(k) are included !
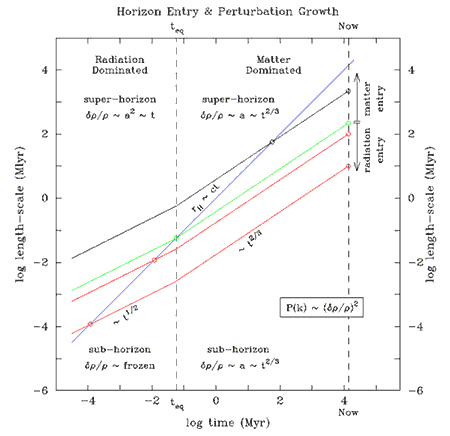
 t½ up to matter-radiation equality, and
t2/3 thereafter). The evolving sizes of four lengthscales are shown,
corresponding to current (comoving) sizes of 10 Mly, 100 Mly, 220 Mly, and 2200 Mly.
Notice the first two cross the Hubble sphere during the radiation era (red lines);
while the latter
two cross it in the matter era (black & green) -- with 220 Mly marking the
boundary (green). Note also that
wavelengths differing by 1 dex now, crossed the Hubble sphere at times differing by
two dex in the radiation era (because the Hubble radius grows linearly
with time, but the wavelengths grow as t½).
Perturbation growth factors for 
 /
/ are also labelled.
Recall that P(k) ~ (
 /
/ )2 so growth in P(k) is "double" that of

 /
/ .
.
There are four cases to consider (see below the figure):
- Super-Horizon Radiation:

 /
/
 a2
a2  t. This is just
the differential expansion rate of slightly over/under dense regions (ie slightly
closed/open mini-universes).
- Sub-Horizon Radiation:

 /
/ is essentially frozen. The density
is dominated by radiation which is trapped by the baryons and oscillates. Dark matter's
self-gravity is dwarfed by the radiation and so its perturbations can't grow.
In truth, growth continues for a while after horizon entry until the initial velocity
is redshifted away; and the CDM can grow logarithmically during this period. In this
toy model, we set the growth in this period to zero.
- Super-Horizon Matter:

 /
/
 a
a  t2/3. This is
identical to the super-horizon radiation growth, except the gentler deceleration in
the matter era (since
  ~ a-3 rather than a-4) slows the growth rate by one power of a.
- Sub-Horizon Matter:

 /
/
 a
a  t2/3. This is a
famous result, because expansion slows collapse of overdensities compared to a static
universe. Notice that this growth rate is the same before and after horizon
entry -- so there is no change associated with horizon entry.
The key point is that while the primordial spectrum, P(k)  k, suggests that
smaller wavelengths should have stronger perturbatons, we notice that
it is the smaller wavelengths that enter the horizon much sooner and so are
prevented from growing relative to larger wavelengths which enter later.
Quantitatively, consider the two red curves with comoving size 100 Mly and 10 Mly.
Their scales differ by 1 dex, so Pinit(k) is 1 dex higher for the 10 Mly
scale. But this enters the horizon two dex earlier. During those two dex,
the 100 Mly scale continues to grow by two dex in
 /
/ before it too is frozen. Both
remain frozen until they are released at equality and from then on they each experience
the same growth. During that 2 dex delay, P(k) for the larger wavelength grew by a
huge 4 dex ! Thus, when we consider the spectral index between the two wavelengths after
equality, it has changed by 4, going from P(k)
  k1 to P(k)
  k-3.
k-3.
This only works when modes enter the horizon during the radiation era. The biggest scale that does this is 220 Mly (in this toy model), shown in green. All scales larger than this experience identical growth -- none are held back at any stage. Hence on scales larger than 220 Mly, the form of P(k) is just its primordial one. The next two figures clarify this.
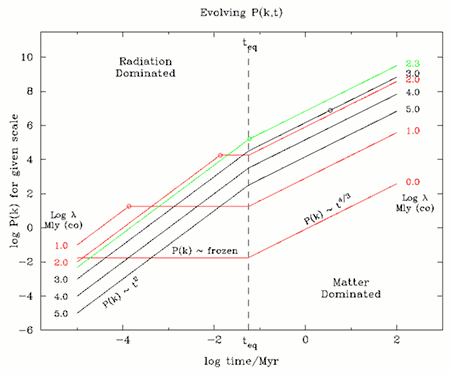
Notice how the black curves preserve their "order" -- decreasing comoving wavelengths of 105, 104, 103 Mly have increasing P(k) at early times, as they do at late times (now). However, the red curves reverse their order: decreasing wavelengths 102, 101, 100 Mly have increasing P(k) at early times (just as they should), but the early entry of the smaller wavelengths freezes them, and reverses their order, so that decreasing wavelengths have decreasing P(k) at late times. Clearly, as a function of wavelength, P(k) will increase with decreasing wavelength at very large wavelengths, reach a peak at the wavelength which just avoids entering the horizon at equality, and then decrease rapidly with further decreasing wavelengths.
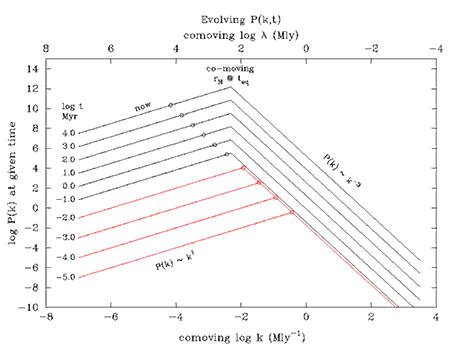
Right Figure shows this effect. The top curve is for the present time, while
the other curves are for earlier times. We find that the evolved P(k) differs
significantly from the initial P(k). They are similar at wavelengths greater
than the horizon size at equality, but below that scale, P(k) falls rapidly as
k-3 for ever smaller scales. A peak appears in P(k) at a comoving
scale equal to the horizon at equality. Since equality occured at z ~ 3700 and
time ~ 57 kyr, then the comoving scale is 3700 × 0.057
 210 Mly. Let's now compare this with the observed data.
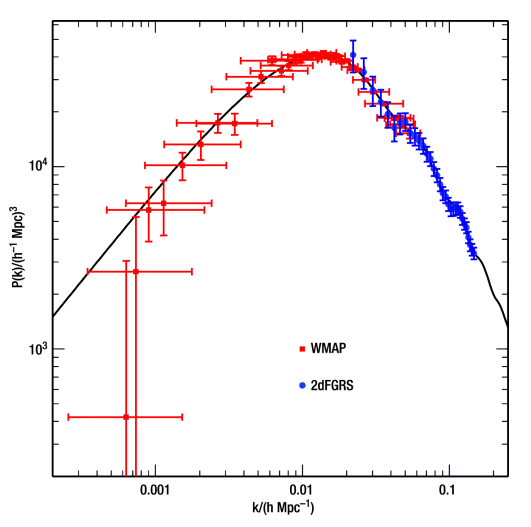
First, although this data doesn't identify the peak well, its scale is roughly as expected: ~few × 100 Mly.
Second, notice the slight wiggles in the calculated P(k) -- these are relics from the baryon acoustic peaks which grew prior to recombination. Their amplitude is greatly reduced since that early time, but they have now been seen in the sloan and 2dF data. They are called "Baryon Oscillations".
Third, notice that the gradient is significantly less then our simple model -- more
like P(k)  k-1 rather than k-3.
This arises because there is some growth in the radiation era -- not zero
as in our toy model (see below).
Right Figure Below shows the resulting P(k). The modified growth in the radiation era leads to a much broader peak, with flatter local gradient on the short wavelength side of the peak -- roughly as observed. Unfortunately, it is difficult to verify the gradual change to k-3 at even shorter scales because non-linear clustering has occurred, which feeds power from large scales to smaller ones. The blue dashed line shows the result of using a sophisticated (CMBFAST type) simulation which confirms the more gently curving peak (though this still doesn't include non-linear growth on small scales).
Growth of P(k) with more reasonable radiation behaviour.
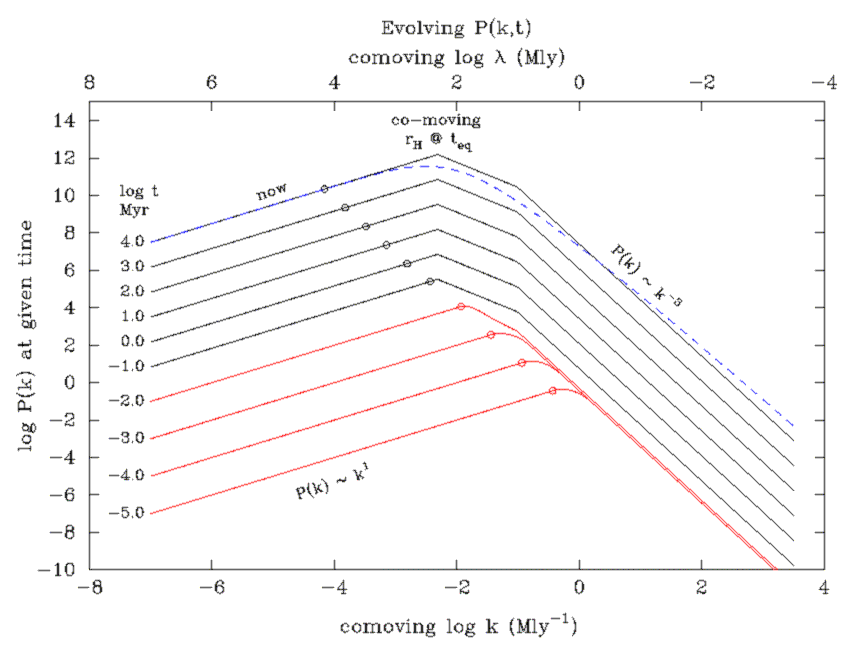
Resulting P(k) showing a broader peak