Earth is geologically alive today. Its interior seethes and its surface constantly changes. Figure 7.13 shows two indicators of surface geological activity: a volcano, where molten rock and hot ash upwell through fissures or cracks in the surface, and (the aftermath of) an earthquake, which occurs when the crust suddenly dislodges under great pressure. Catastrophic volcanoes and earthquakes are relatively rare events these days, but geological studies of rocks, lava, and other surface features imply that surface activity must have been more frequent, and probably more violent, long ago.
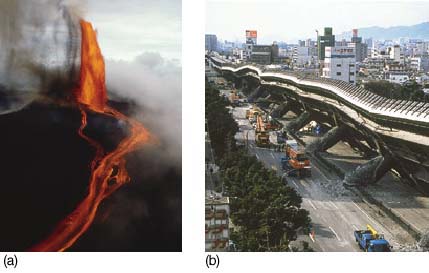
Figure 7.13 (a) An active volcano on Mount Kilauea in Hawaii. Kilauea seems to be a virtually ongoing eruption. Other eruptions, such as that of Mount St. Helens in Washington State on May 18, 1980, are catastrophic events that can release more energy than the detonation of a thousand nuclear bombs. (b) The aftermath of an earthquake that claimed more than 5000 lives and caused billions of dollars' worth of damage in Kobe, Japan, in January 1995.
 Many traces of past geological events are scattered across our globe. Erosion by wind and water has wiped away much of the evidence for ancient activity, but modern exploration has documented the sites of most of the recent activity, such as earthquakes and volcanic eruptions. Figure 7.14 is a map of the currently active areas of our planet. The red dots represent sites of volcanism or earthquakes. Nearly all these sites have experienced surface activity within this century, some of them suffering much damage and the loss of many lives.
The intriguing aspect of Figure 7.14 is that the active sites are not spread evenly across our planet. Instead, they trace well-defined lines of activity, where crustal rocks dislodge (as in earthquakes) or mantle material upwells (as in volcanoes). In the mid-1960s, it became clear that these lines are really the outlines of gigantic "plates," or slabs of Earth's surface. Most startling of all, the plates are slowly moving—literally drifting around the surface of our planet. These plate motions have created the surface mountains, the oceanic trenches, and the other large-scale features across the face of planet Earth. In fact, plate motions have shaped the continents themselves. The process is popularly known as "continental drift." The technical term for the study of plate movement and its causes is plate tectonics. The major plates of the world are marked on Figure 7.14.
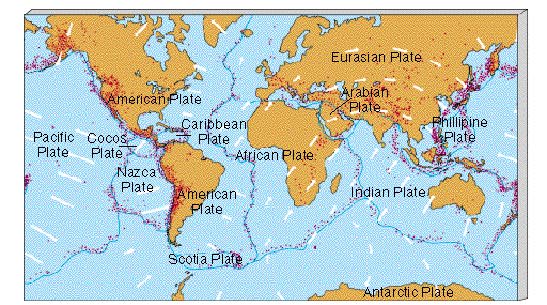
Figure 7.14 Red dots represent active sites where major volcanoes or earthquakes have occurred in the twentieth century. Taken together, the sites outline vast "plates" that drift around on the surface of our planet. The arrows show the general directions of the plate motions.
The plates are not simply slowing to a stop after some ancient initial movements. Rather, they are still drifting today, although at an extremely slow rate. Typically, the speeds of the plates amount to only a few centimeters per year—about the same rate as your fingernails grow. This is well within the measuring capabilities of modern equipment. Curiously, one of the best ways of monitoring plate motion on a global scale is by making accurate observations of very distant astronomical objects. Quasars (see Chapter 25), lying many hundreds of millions of light years from Earth, will never show any measurable apparent motion on the sky stemming from their own motion in space. Thus any apparent change in their position (after correction for Earth's motion, of course) can be interpreted as arising from the motion of the telescope—or of the plate on which it is located. On smaller scales, laser-ranging and other techniques now routinely track the relative motion of plates in many populated areas, such as California.
During the course of Earth history, each plate has had plenty of time to move large distances, even at its sluggish pace. For example, a drift rate of only 2 cm per year can cause two continents (for example, Europe and North America) to separate by some 4000 km over the course of 200 million years. That may be a long time by human standards, but it represents only about 5 percent of the age of Earth.
A common misconception is that the plates are the continents themselves. Some plates are indeed made mostly of continental landmasses, but other plates are made of a continent plus a large part of an ocean. For example, the Indian plate includes all of India, much of the Indian Ocean, and all of Australia and its surrounding south seas (see Figure 7.14). Still other plates are mostly ocean. The seafloor itself is the slowly drifting plate, and the oceanic water merely fills in the depressions between continents. The southeastern portion of the Pacific Ocean, called the Nazca plate, contains no landmass at all. For the most part, the continents are just passengers riding on much larger plates. Taken together, the plates make up Earth's lithosphere, which contains both the crust and a small part of the upper mantle. The lithosphere is the portion of Earth that undergoes tectonic activity. The semisolid part of the mantle over which the lithosphere slides is known as the asthenosphere. The relationships between these regions of Earth are shown in Figure 7.15.
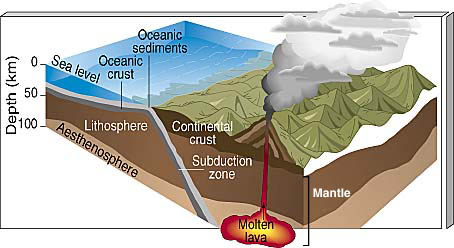
Figure 7.15 The outer layers of Earth's interior. The rocky lithosphere comprises both the crust and part of Earth's upper mantle. It is typically between 50 and 100 km thick. Below it lies the asthenosphere, a relatively soft part of the mantle over which the lithosphere slips.
As the plates drift around, we might expect collisions to be routine. Indeed, plates do collide. But unlike two automobiles that collide and then stop, the surface plates are driven by enormous forces. They do not stop easily. Instead, they just keep crunching into one another. Figure 7.16(a) shows a collision currently occurring between two continental landmasses: the subcontinent of India, on the prow of the northward-moving Indian plate, is crashing into the landmass of Asia, located on the Eurasian plate (see Figure 7.14).The resulting folds of rocky crust create mountains—in this case the snow-covered Himalayan mountain range at upper right. A peak like Mount Everest (Figure 7.16b) represents a portion of Earth's crust that has been lifted over 8800 m by the slow but inexorable force produced when one plate plows into another.
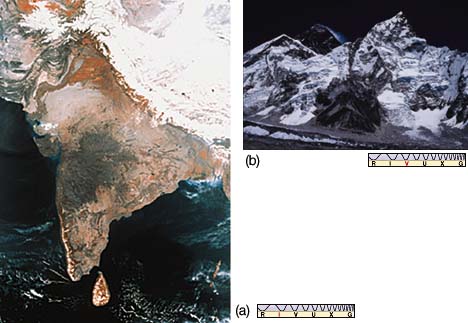
Figure 7.16 Mountain building results largely from plate collisions. (a) The subcontinent of India, imaged here in infrared light from orbit, lies at the northernmost tip of the Indian plate. As this plate drifts northward, the Indian landmass collides with Asia, on the Eurasian plate. The impact causes Earth's crust to buckle and fold, thrusting up the Himalayan mountain range (covered with snow at the upper right). (b) The results of this process can be seen in this view of Mount Everest.
Not all colliding plates produce mountain ranges. At other collision locations, called subduction zones, one plate slides under the other, ultimately to be destroyed as it sinks into the mantle. Subduction zones are responsible for most of the deep trenches in the world's oceans.
Nor do all plates experience head-on collisions. As noted by the arrows of Figure 7.14, many plates slide or shear past one another. A good example is the most famous active region in North America—the San Andreas Fault in California (Figure 7.17). The site of much earthquake activity, this fault marks the boundary where the Pacific and North American plates are rubbing past each other. The motion of these two plates, like that of moving parts in a poorly oiled machine, is neither steady nor smooth. The sudden jerks that occur when they do move against each other are often strong enough to cause major earthquakes.
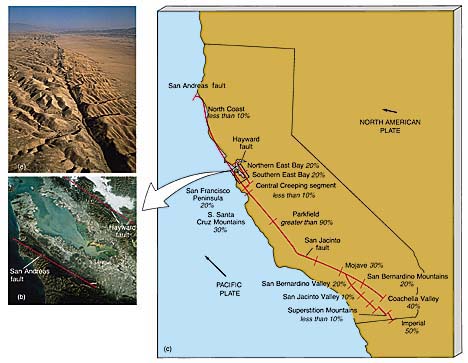
Figure 7.17 The San Andreas and associated faults in California result as the North American and Pacific plates slide past each other. The Pacific plate, which includes a large slice of the California coast, is drifting to the northwest with respect to the North American plate. (a) A small part of the fault line separating the two plates. (b) A satellite photo of the San Francisco Bay area, showing the location of two fault lines. (c) A larger-scale view of the fault system. The numbers represent estimates of the probability of a major earthquake occurring during a 30-year period at various locations along the faults.
At still other locations, the plates are moving apart. As they recede, new mantle material wells up between them, forming midocean ridges. Notice in Figure 7.14 the major boundary separating the North and South American plates from the Eurasian and African plates, marked by the thin strip down the middle of the Atlantic Ocean. Discovered after World War II by oceanographic ships studying the geography of the seafloor, this giant fault is called the Mid-Atlantic Ridge. It extends, like a seam on a giant baseball, all the way from Scandinavia in the North Atlantic to the latitude of Cape Horn at the southern tip of South America. The entire ridge is a region of seismic and volcanic activity, but the only major part of it that rises above sea level is the island of Iceland.
Robot submarines have retrieved samples of the ocean floor at a variety of locations on either side of the Mid-Atlantic Ridge, and the ages of the samples have been measured using radioactive dating techniques. As depicted in Figure 7.18, the ocean floor closest to the ridge is relatively young, whereas material farther away, on either side, is older—exactly as we would expect if hot molten matter is upwelling and solidifying as the plates on either side drift apart. The Atlantic Ocean has apparently been growing in this way for the past 200 million years, the oldest age found on any part of the Atlantic seafloor.
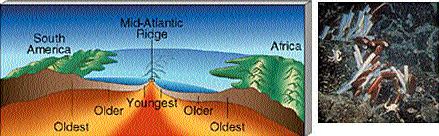
Figure 7.18 Samples of ocean floor retrieved by oceanographic vessels are youngest close to the Mid-Atlantic Ridge and progressively older farther away.
Other studies of the Mid-Atlantic Ridge have yielded important information about Earth's magnetic field. As hot mantle material (carrying traces of iron) emerges from cracks in the oceanic ridges and solidifies, it becomes slightly magnetized, retaining an imprint of Earth's magnetic field at the time of cooling. Thus, the ocean floor has preserved within it a record of Earth's magnetism during past times, rather like a tape recording. Figure 7.19 is a diagram of a small portion of the Atlantic Ocean floor near Iceland. Earth's current magnetism is oriented in the familiar north—south fashion, and when samples of ocean floor close to the ridge are examined, the iron deposits are oriented just as expected—north—south. This is the "young" basalt that upwelled and cooled fairly recently. However, samples retrieved farther from the ridge, corresponding to older material that upwelled long ago, are often magnetized with the opposite orientation. As we move away from the ridge, the imprinted magnetic field flips back and forth, more or less regularly and symmetrically on either side of the ridge.
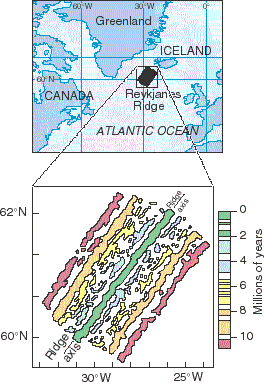
Figure 7.19 Samples of basalt retrieved from the ocean floor often show Earth's magnetism to have been oriented oppositely from the current north—south magnetic field. This simplified diagram shows the ages of some of the regions in the vicinity of the Mid-Atlantic Ridge (see Figure 7.14), together with the direction of the fossil magnetic field. The colored areas have the current orientation; they are separated by regions of reversed magnetic polarity.
Scientists believe that these different magnetic orientations were caused by reversals in Earth's magnetic field that occurred as the plates drifted away from the central ridge. Working backward, we can use the fossil magnetic field to infer the past positions of the plates, as well as the orientation of Earth's magnetism. In addition to providing strong support for the idea of seafloor spreading, these measurements, when taken in conjunction with the data on seafloor age, allow us to time our planet's magnetic reversals. On average, Earth's magnetic field reverses itself roughly every half-million years. Dynamo theory suggests that such reversals are part of the way in which all planetary magnetic fields are generated. As we will see in Chapter 16, a similar phenomenon (with a reversal time of approximately 11 years) is also observed on the Sun.
What process is responsible for the enormous forces that drag plates apart in some locations and ram them together in others? The answer is probably convection—the same physical process we encountered earlier in our study of the atmosphere.
Figure 7.20 is a cross-sectional diagram of the top few hundred kilometers of our planet's interior. It depicts roughly the region in and around a midocean ridge. There the ocean floor is covered with a layer of sediment—dirt, sand, and dead sea organisms that have fallen through the seawater for millions of years. Below the sediment lies about 10 km of granite, the low-density rock that makes up the crust. Deeper still lies the upper mantle, whose temperature increases with depth. Below the base of the lithosphere, at a depth of perhaps 50 km, the temperature is sufficiently high that the mantle is soft enough to flow, very slowly, although it is not molten. This region is the asthenosphere.
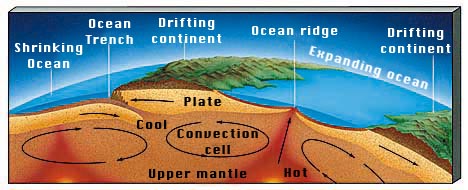
Figure 7.20 Plate drift is probably caused by convection—in this case, giant circulation patterns in the upper mantle that drag the plates across the surface.
This is a perfect setting for convection—warm matter underlying cool matter. The warm mantle rock rises, just as hot air rises in our atmosphere. Sometimes, the rock squeezes up through cracks in the granite crust. Every so often, such a fissure may open in the midst of a continental landmass, producing a volcano such as Mount St. Helens or possibly a geyser like those at Yellowstone National Park. However, most such cracks are underwater. The Mid-Atlantic Ridge is a prime example.
Not all the rising warm rock in the upper mantle can squeeze through cracks and fissures. Some warm rock cools and falls back down to lower levels. In this way, large circulation patterns become established within the upper mantle, as depicted in Figure 7.20. Riding atop these convection patterns are the plates. The circulation is extraordinarily sluggish. Semisolid rock takes millions of years to complete one convection cycle. Although the details are far from certain and remain controversial, many researchers believe that it is the large-scale circulation patterns near plate boundaries that ultimately drive the motion of the plates.
Figure 7.21 illustrates how all the continents nearly fit together like pieces of a puzzle. Note especially how the Brazilian coast meshes with the Ivory Coast of Africa. In fact, most of the continental landmasses in the Southern Hemisphere fit together remarkably well. Following the arrows on Figure 7.14 backward, we can see that the fits are roughly consistent with the present motions of the plates involved. The fits would be even better if we were to consider the entire continental shelves (the continental borders, which are underwater) instead of just the portions that happen to stick up above sea level.

Figure 7.21 Given the currently estimated drift rates and directions of the plates, we can trace their movements back into the past. About 200 million years ago, they would have been at the approximate positions shown in (a). The continents' current positions are shown in (d).
Geologists now believe that sometime in the past a single gargantuan landmass dominated our planet. This ancestral supercontinent, known as Pangaea (meaning "all lands"), is shown in Figure 7.21(a). The rest of the planet was presumably covered with water. The present locations of the continents, along with measurements of their current drift rates, suggest that Pangaea was the major land feature on Earth approximately 200 million years ago. Dinosaurs, which were then the dominant form of life, could have sauntered from Russia to Texas via Boston without getting their feet wet. Indeed, it was the existence of similar-looking fossils on opposite sides of the Atlantic Ocean, together with the striking geographical fit of the continents, that first led scientists to suggest the idea of continental drift early in the twentith century. The other frames in Figure 7.21 show how Pangaea split apart, eventually leading to the familiar continents of today.
Of course, there is nothing particularly special about a time 200 million years in the past. We do not suppose that Pangaea remained intact for some 4 billion years after the crust first formed, only to break up so suddenly and so (relatively) recently. Much more likely, Pangaea itself came into existence after an earlier period during which other plates, carrying widely separated continental masses, were driven together by tectonic forces, merging their landmasses to form a single supercontinent. It is quite possible that there has been a long series of "Pangaeas" stretching back in time over much of Earth's history. There will probably be many more.