Lacking any direct measurements of the solar interior, astronomers must use more indirect means to probe the inner workings of our parent star. To accomplish this, they construct mathematical models of the Sun, combining all available observations with theoretical insight into solar physics. The result is the Standard Solar Model, which has gained widespread acceptance among astronomers.
To test and refine the Standard Solar Model, astronomers are eager to obtain information about the solar interior. However, we have little or no direct information about conditions below the solar photosphere, so we must rely on more indirect techniques. In the 1960s it was discovered that the surface of the Sun vibrates like a complex set of bells. These vibrations, illustrated in Figure 16.4, are the result of internal pressure ("sound") waves that reflect off the photosphere and repeatedly cross the solar interior. Because these waves can penetrate deep inside the Sun, analysis of their surface patterns allows scientists to study conditions far below the Sun's surface. This process is similar to the way in which seismologists study the interior of Earth by observing the P- and S-waves produced by earthquakes.  (Sec. 7.3) For this reason, study of solar surface patterns is usually called helioseismology, even though solar pressure waves have nothing whatever to do with solar seismic activity—there is no such thing.
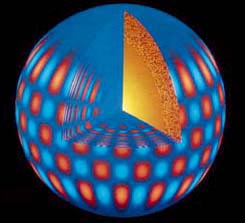
Figure 16.4 The Sun has been found to vibrate in a very complex way. By observing the motion of the solar surface, scientists can determine the wavelength and the frequencies of the individual waves and deduce information about the solar interior not obtainable by other means. The alternating patches represent gas moving down (red) and up (blue). (See also Interlude 16-1.)
The most extensive study of solar oscillations is the ongoing GONG (Global Oscillations Network Group) project. By making continuous observations of the Sun from many clear sites around Earth and, most recently, from space (see Interlude 16-1), solar astronomers can obtain uninterrupted high-quality solar data spanning many days and even weeks—almost as though Earth were not rotating and the Sun never set. Analysis of these data provides important additional information about the temperature, density, rotation, and the convective state of the solar interior, allowing detailed comparisons between theory and reality to be made.
Figure 16.5 shows the solar density and temperature according to the Standard Solar Model, plotted as functions of distance from Sun's center. Notice how the density drops rather sharply at first, then decreases more slowly near the solar photosphere, some 700,000 km from the center. The variation in density is large, ranging from a core value of about 150,000 kg/m3, 20 times the density of iron, to an intermediate value (at 350,000 km) of about 1000 kg/m3, the density of water, to an extremely small photospheric value of 2 ![]() 10-4 kg/m3, about 10,000 times less dense than air at the surface of Earth. Because the density is so high in the core, roughly 90 percent of the Sun's mass is contained within the inner half of its radius. The solar density continues to decrease out beyond the photosphere, reaching values as low as 10-23 kg/m3 in the far corona—about as thin as the best vacuum physicists can create in laboratories on Earth.
10-4 kg/m3, about 10,000 times less dense than air at the surface of Earth. Because the density is so high in the core, roughly 90 percent of the Sun's mass is contained within the inner half of its radius. The solar density continues to decrease out beyond the photosphere, reaching values as low as 10-23 kg/m3 in the far corona—about as thin as the best vacuum physicists can create in laboratories on Earth.
Figure 16.5 Theoretically modeled profiles of density (b) and temperature (c) for the solar interior, presented for perspective in (a). All three parts describe a cross-sectional cut through the center of the Sun.
The solar temperature also decreases with increasing radius, but not so rapidly as the density. Computer models indicate a temperature of about 15,000,000 K at the core, consistent with the minimum 10,000,000 K needed to initiate the nuclear reactions known to power most stars, decreasing to the observed value of about 5800 K at the photosphere.
 The very hot solar interior ensures violent and frequent collisions among gas particles. Particles move in all directions at high speeds, bumping into one another unceasingly. In and near the core, the extremely high temperatures guarantee that the gas is completely ionized. Recall from Chapter 4 that under less extreme conditions, atoms absorb photons that can boost their electrons to more excited states. (Sec. 4.2) With no electrons left on atoms to capture the photons, however, the deep solar interior is quite transparent to radiation. Only occasionally does a photon encounter and scatter off a free electron or proton. As a result, the energy produced by nuclear reactions in the core travels outward toward the surface in the form of radiation with relative ease.
As we move outward from the core, the temperature falls, atoms collide less frequently and less violently, and more and more electrons manage to remain bound to their parent nuclei. With more and more atoms retaining electrons that can absorb the outgoing radiation, the gas in the interior changes from being relatively transparent to being almost totally opaque. By the outer edge of the radiation zone, 200,000 km below the photosphere, all the photons produced in the Sun's core have been absorbed. Not one of them reaches the surface. But what happens to the energy they carry?
The photons' energy must travel beyond the Sun's interior. That we see sunlight—visible energy—proves that energy escapes. That energy reaches the surface by convection—the same basic physical process we saw in our study of Earth's atmosphere, although it operates in a very different environment in the Sun. (Sec. 7.2) Hot solar gas physically moves outward while cooler gas above it sinks, creating a characteristic pattern of convection cells. All through the convection zone, energy is transported to the surface by physical motion of the solar gas. (Remember that there is no physical movement of material when radiation is the energy-transport mechanism; convection and radiation are fundamentally different ways in which energy can be transported from one place to another.)
Figure 16.6 Physical transport of energy in the Sun's convection zone. We can visualize the upper interior as a boiling, seething sea of gas. Each convective loop is about 1000 km across. The convective cells are arranged in tiers with cells of progressively smaller size as the surface is neared. (This is a highly simplified diagram; there are many different cell sizes, and they are not so neatly arranged.)
In reality, the zone of convection is much more complex than we have just described. As illustrated in Figure 16.6, there is a hierarchy of convection cells, organized in tiers at different depths. The deepest tier, about 200,000 km below the photosphere, is thought to contain large cells some tens of thousands of kilometers in diameter. Heat is then successively carried upward through a series of progressively smaller sized cells, stacked one on another until, at a depth of about 1000 km, the individual cells are about 1000 km across. The top of this uppermost tier of convection is the visible surface, where astronomers can directly observe the cell sizes. Information about convection below that level is inferred mostly from computer models of the solar interior.
At some distance from the core the solar gas becomes too thin to sustain further upwelling by convection. Theory suggests that this distance roughly coincides with the photospheric surface we see. Convection does not proceed into the solar atmosphere. There is simply not enough gas there. The density is so low that the gas becomes transparent once again, and radiation once again becomes the mechanism of energy transport. Photons reaching the photosphere escape more or less freely into space, and the photosphere emits thermal radiation, like any other hot object. The photosphere is narrow, and the "edge" of the Sun sharp, because this transition from opacity to complete transparency is very rapid. Just below the bottom of the photosphere the gas is still convective, and radiation does not reach us directly. A few hundred kilometers higher, the gas is too thin to emit or absorb any significant amount of radiation.
Figure 16.7 is a high-resolution photograph of the solar surface taken with instruments aboard NASA's Skylab space station as it orbited above much of Earth's atmosphere in the mid-1970s. The visible surface is highly mottled, or granulated, with regions of bright and dark gas known as granules. Each bright granule measures about 1000 km across—comparable in size to a continent on Earth—and has a lifetime of between 5 and 10 minutes. Together, several million granules constitute the top layer of the convection zone, immediately below the photosphere.

Figure 16.7 Skylab photograph of the granulated solar photosphere. Typical solar granules are comparable in size to Earth's continents. The bright portions of the image are regions where hot material is upwelling from below. The dark regions correspond to cooler gas that is sinking back down into the interior.
Each granule forms the topmost part of a solar convection cell. Spectroscopic observation within and around the bright regions shows direct evidence for the upward motion of gas as it "boils" up from within. This evidence proves that convection really does occur just below the photosphere. Spectral lines detected from the bright granules appear slightly bluer than normal, indicating Doppler-shifted matter approaching us at about 1 km/s. (Sec. 3.5) Conversely, spectroscopes focused on the darker portions of the granulated photosphere show the same spectral lines to be redshifted, indicating matter moving away from us.
The brightness variations of the granules result strictly from differences in temperature. The upwelling gas is hotter and therefore emits more radiation than the cooler downwelling gas. The adjacent bright and dark gases appear to contrast considerably, but in reality their temperature difference is less than about 500 K. Careful measurements also reveal a much larger scale flow on the solar surface. Supergranulation is a flow pattern quite similar to granulation except that supergranulation cells measure some 30,000 km across. As with granulation, material upwells at the center of the cells, flows across the surface, then sinks down again at the edges. Scientists believe that supergranules are the imprint on the photosphere of a deeper tier of large convective cells, like those depicted in Figure 16.6.