Most of the Sun's luminosity results from continuous emission from the photosphere. This radiation arises from what we call the quiet Sun—the underlying predictable star that blazes forth day after day. This steady behavior contrasts with the sporadic, unpredictable radiation of the active Sun, a much more irregular component of our star's energy output, characterized by explosive, unpredictable behavior. This aspect of solar radiation contributes little to the Sun's total luminosity and has little effect on the evolution of the Sun as a star, but it does affect us directly here on Earth (see Interlude 16-2). The size and duration of coronal holes are strongly influenced by the level of solar activity, as is the strength of the solar wind.
Figure 16.15 is an optical photograph of the entire Sun, showing numerous dark blemishes on the surface. First studied in detail by Galileo, these "spots" provided one of the first clues that the Sun was not a perfect unvarying creation but a place of constant change.  (Sec. 2.5) These dark areas are called sunspots. They typically measure about 10,000 km across, about the size of Earth. As shown in the figure, they often occur in groups. At any given time, the Sun may have hundreds of sunspots, or it may have none at all.
Studies of sunspots show an umbra, or dark center, surrounded by a grayish penumbra. The close-up views in Figure 16.16 shows each of these dark areas and the brighter undisturbed photosphere nearby. This gradation in darkness is really a gradual change in photospheric temperature—sunspots are simply cooler regions of the photospheric gas. The temperature of the umbra is about 4500 K, compared with the penumbra's 5500 K. The spots, then, are certainly composed of hot gases. They seem dark only because they appear against an even brighter background (the 5800 K photosphere). If we could magically remove a sunspot from the Sun (or just block out the rest of the Sun' emission), the spot would glow brightly, just like any other hot object having a temperature of roughly 5000 K.

Figure 16.15 This photograph of the entire Sun, taken during a period of maximum solar activity, shows several groups of sunspots. The largest spots in this image are over 20,000 km across—twice the diameter of Earth. Typical sunspots are only about half this size.
Figure 16.16 (a) An enlarged photograph of the largest pair of sunspots in Figure 16.15. Each spot consists of a cool, dark inner region called the umbra, surrounded by a warmer, brighter region called the penumbra. The spots appear dark because they are slightly cooler than the surrounding photosphere. (b) A high-resolution, true-color image of a single sunspot shows details of its structure as well as much surface granularity surrounding it. The spot is about the size of Earth.
Sunspots are not steady. Most change their size and shape, and all come and go. Figure 16.17 shows a time sequence in which several spots varied—sometimes growing, sometimes dissipating—over a period of several days. Individual spots may last anywhere from 1 to 100 days. A large group of spots typically lasts 50 days.

Figure 16.17 The evolution of some sunspots and lower chromospheric activity over a period of 12 days. The sequence runs from left to right. An H filter was used to make these photographs, taken from the Skylab space station. An arrow follows one set of sunspots over the course of a week as they are carried around the Sun by its rotation.
What causes a sunspot? Why is it cooler than the surrounding photosphere? The answers to these questions involve the Sun's magnetism. As we saw in Chapter 4, analysis of spectral lines can yield information about the magnetic field where they originate. (Sec. 4.4) The magnetic field in a typical sunspot is about 1000 times greater than the field in neighboring, undisturbed photospheric regions (which is itself several times stronger than Earth's magnetic field). Scientists believe that sunspots are cooler than their surroundings because these abnormally strong fields tend to block (or redirect) the convective flow of hot gas, which is normally toward the surface of the Sun.
Another indicator of the magnetic nature of sunspots is their grouping. They almost always come in pairs, and the magnetic fields observed in the two members of any pair are always opposite to one another—the members of the pair are said to have opposite magnetic polarities. As illustrated in Figure 16.18, magnetic field lines emerge from the interior through one member of a sunspot pair, loop through the solar atmosphere, then reenter the solar surface through the other spot. What's more, all the sunspot pairs in the same solar hemisphere (north or south) at any instant have the same magnetic configuration—if the magnetic field lines are directed into the Sun in one leading spot (measured in the direction of the Sun's rotation), they are inwardly directed in all leading spots in that hemisphere. In the other hemisphere at the same time all sunspot pairs have the opposite polarity. Despite the irregularity of the sunspots themselves, these correlations suggest a high degree of order in the solar magnetic field.
Figure 16.18 Sunspot pairs are linked by magnetic field lines. The Sun's magnetic field emerges from the surface through one member of the pair and reenters the Sun through the other. The leading members of all sunspot pairs in the solar northern hemisphere have the same polarity—if the magnetic field lines are directed into the Sun in one leading spot, they are inwardly directed in all leading spots in that hemisphere. The same is true in the southern hemisphere, except that the polarities are always opposite those in the north.
The Sun is gaseous and rotates differentially, and these facts radically affect the character of solar magnetism. As illustrated in Figure 16.19, because the Sun rotates more rapidly at the equator than at the poles, the differential rotation distorts the solar magnetic field, wrapping it around the solar equator, eventually causing the original north—south magnetic field to reorient itself in an east—west direction. Convection then causes the magnetized gas to upwell toward the surface, twisting and tangling the magnetic field pattern. In some places, the field becomes kinked like a knot in a garden hose, causing it to increase in strength. Occasionally, the field strength becomes so great that it overwhelms the Sun's gravitational field and a "tube" of field lines bursts out of the surface and loops through the lower atmosphere, forming a sunspot pair. The general east—west organization of the underlying solar field accounts for the observed polarities of the pairs in each hemisphere.
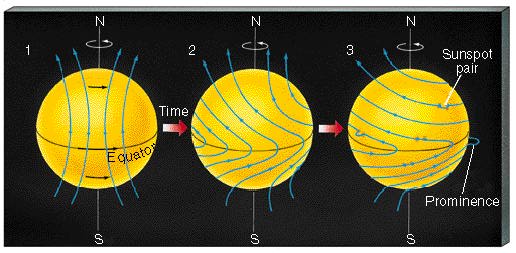
Figure 16.19 This diagram illustrates how the Sun's differential rotation wraps and distorts the solar magnetic field. Occasionally, the field lines burst out of the surface and loop through the lower atmosphere, thereby creating a sunspot pair. The underlying pattern of the solar field lines explains the observed pattern of sunspot polarities. (If the loop happens to occur on the limb of the Sun and is seen against the blackness of space, we see a phenomenon called a prominence, described in Section 16.4.)
Not only do sunspots come and go with time, but their numbers and distribution across the face of the Sun also change in a fairly regular fashion. Centuries of observations have established a clear sunspot cycle. Figure 16.20(a) shows the number of sunspots observed each year during the twentieth century. The average number of spots reaches a maximum every 11 or so years, then falls off almost to zero before the cycle begins afresh.

Figure 16.20 (a) Annual number of sunspots throughout the twentieth century, showing the 5-year average of the annual data to make long-term trends more evident. The (roughly) 11-year solar cycle is clearly visible. At the time of solar minimum, hardly any sunspots are seen. About 4 years later, at solar maximum, as many as 100—200 spots are observed per year. The most recent solar maximum occurred in 1990. (b) Sunspots cluster at high latitudes when solar activity is at a minimum. They appear at lower latitudes as the number of sunspots peaks. Finally, they are prominent near the Sun's equator as solar minimum is again approached.
The latitudes at which sunspots appear vary as the sunspot cycle progresses. Individual sunspots do not move up or down in latitude, but new spots appear closer to the equator as older ones at higher latitudes fade away. Figure 16.20(b) is a plot of observed sunspot latitude as a function of time. At the start of each cycle, at the time of solar minimum, only a few spots are seen. They are generally confined to two narrow zones about 25° to 30° north and south of the solar equator. Approximately 4 years into the cycle, around the time of solar maximum, the number of spots has increased markedly. They are found within about 15° to 20° of the equator. Finally, by the end of the cycle, at solar minimum again, the total number has fallen again, and most sunspots lie within about 10° of the solar equator. The beginning of each new cycle appears to overlap the end of the last.
Complicating this picture further, the 11-year sunspot cycle is actually only half of a longer 22-year solar cycle. During the first 11 years of the solar cycle, the leading spots of all the pairs in the northern hemisphere have the same polarity, while spots in the southern hemisphere have the opposite polarity (Figure 16.18). These polarities then reverse their signs for the next 11 years, so the full solar cycle takes 22 years to repeat.
Astronomers believe that the Sun's magnetic field is both generated and amplified by the constant stretching, twisting, and folding of magnetic field lines that results from the combined effects of differential rotation and convection. The theory is essentially the same "dynamo" theory that accounts for the magnetic fields of Earth and the jovian planets, except that the solar dynamo operates much faster, and on a much larger scale. (Sec. 7.4) One prediction of this theory is that the Sun's magnetic field should rise to a maximum, then fall to zero and reverse itself in a more or less periodic way, just as observed. Solar surface activity, such as the sunspot cycle, simply follows the variations in the magnetic field. The changing numbers of sunspots and their migration to lower latitudes are both consequences of the strengthening and eventual decay of the field lines as they become more and more tightly wrapped around the solar equator.
Figure 16.21 plots all sunspot data recorded since the invention of the telescope. As can be seen, the 11-year "periodicity" of the solar sunspot cycle is far from regular. Not only does the period range from 7 to 15 years, but the sunspot cycle has disappeared entirely in the relatively recent past. The lengthy period of solar inactivity that extended from 1645 to 1715 is called the Maunder minimum, after the British astronomer who drew attention to these historical records. The corona was apparently also less prominent during total solar eclipses around that time, and Earth aurorae were sparse throughout the late seventeenth century. Lacking a complete understanding of the solar cycle, we cannot easily explain how it could shut down entirely. Most astronomers suspect changes in the Sun's convection zone and/or its rotation pattern, but the specific cause of the Sun's century-long variations remains a mystery.
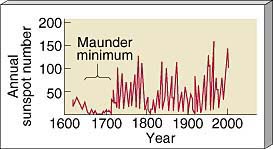
Figure 16.21 Number of sunspots occurring each year over the past four centuries. Note the absence of spots during the late seventeenth century.
Sunspots are relatively quiescent aspects of solar activity. However, the photosphere surrounding them occasionally erupts violently, spewing forth large quantities of energetic particles into the surrounding corona. The sites of these explosive events are known simply as active regions. Most pairs or groups of sunspots have active regions associated with them. Like all other aspects of solar activity, these phenomena tend to follow the solar cycle and are most frequent and violent around the time of solar maximum.
Figure 16.22 shows two solar prominences—loops or sheets of glowing gas ejected from an active region on the solar surface, moving through the inner parts of the corona under the influence of the Sun's magnetic field. Magnetic instabilities in the strong fields found in and near sunspot groups may cause the prominences, although the details are still not completely understood. Observations like Figure 16.22(a) clearly show streams of hot ionized gas soaring high into the solar atmosphere, following the arching magnetic field lines between members of a sunspot pair (see also Figure 16.18).
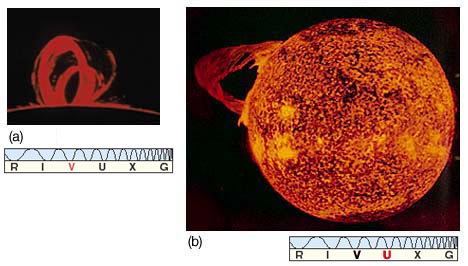
Figure 16.22 (a) The looplike structure of this prominence clearly reveals the magnetic field lines connecting the two members of a sunspot pair. (b) This particularly large solar prominence was observed by ultraviolet detectors aboard the Skylab space station in 1979. (See also Figures 16.18 and 16.19.)
Quiescent prominences persist for days or even weeks, hovering high above the photosphere, suspended by the Sun's magnetic field. Active prominences come and go much more erratically, changing their appearance in a matter of hours or surging up from the solar photosphere, then immediately falling back on themselves. A typical solar prominence measures some 100,000 km in extent, nearly 10 times the diameter of planet Earth. Prominences as large as that shown in Figure 16.22(b) (which traversed almost half a million kilometers of the solar surface) are less common and usually appear only at times of greatest solar activity. The largest prominences can release up to 1025 joules of energy, counting both particles and radiation—not much compared with the total solar luminosity of 4 ![]() 1026 W but still enormous by terrestrial standards. (All the power plants on Earth would take a billion years to produce this much energy.)
1026 W but still enormous by terrestrial standards. (All the power plants on Earth would take a billion years to produce this much energy.)
Flares are another type of solar activity observed low in the Sun's atmosphere near active regions. Also the result of magnetic instabilities, flares, like that shown in Figure 16.23, are even more violent (and even less well understood) than prominences. They often flash across a region of the Sun in minutes, releasing enormous amounts of energy as they go. Observations made by the Solar Maximum satellite demonstrated that X-ray and ultraviolet emissions are especially intense in the extremely compact hearts of flares, where temperatures can reach 100,000,000 K. So energetic are these cataclysmic explosions that some researchers have likened flares to bombs exploding in the lower regions of the Sun's atmosphere.

Figure 16.23 (a) Much more violent than a prominence, a solar flare is an explosion on the Sun's surface that sweeps across an active region in a matter of minutes, accelerating solar material to high speeds and blasting it into space. Visible here as the white, snakelike feature at the center, this flare extends across some 30,000 km. (b) A similar flare is seen from the side in this dramatic photograph, taken through a red Hfiler.
A major flare can release as much energy as the largest prominences, but in a matter of minutes or hours rather than days or weeks. Unlike the gas that makes up the characteristic loop of a prominence, the particles produced by a flare are so energetic that the Sun’s magnetic field is unable to hold them and shepherd them back to the surface. Instead, the particles are simply blasted into space by the violence of the explosion.
The solar corona also varies in step with the sunspot cycle. The photograph of the corona in Figure 16.12 shows the quiet Sun, at sunspot minimum. The corona is fairly regular in appearance and appears to surround the Sun more or less uniformly. Compare this image with Figure 16.24, which was taken in 1991, close to the most recent peak of the sunspot cycle. The active corona is much more irregular in appearance and extends farther from the solar surface. The “streamers” of coronal material pointing away from the Sun are characteristic of this phase.

Figure 16.24 Photograph of the solar corona during the July, 1991 eclipse, at the peak of the sunspot cycle. At these times, the corona is much less regular and much more extended than at sunspot minimum (compare Figure 16.12). Astronomers believe that coronal heating is caused by surface activity on the Sun. The changing shape and size of the corona are the direct result of variations in prominence and flare activity over the course of the solar cycle.
Astronomers think that the corona is heated primarily by solar surface activity, particularly prominences and flares, which can inject large amounts of energy into the upper solar atmosphere, greatly distorting its shape. Extensive disturbances often move through the corona above an active site in the photosphere, distributing the energy throughout the coronal gas. Given this connection, it is hardly surprising that both the appearance of the corona and the strength of the solar wind are closely correlated with the solar cycle.