Figure 18.5 is a mosaic of photographs showing a region of the sky even larger than that shown in Figure 18.1. The bright areas are made up of myriad unresolved stars. The dark areas are vast pockets of dust, blocking from our view what would otherwise be a rather smooth distribution of bright starlight. The patchiness of the obscuration is plainly evident. From our vantage point on Earth this assemblage of stellar and interstellar matter stretches all the way across the sky. On a clear night it is visible to the naked eye as the Milky Way. In Chapter 23 we will come to recognize this band as the flattened disk, or plane, of our own Galaxy.
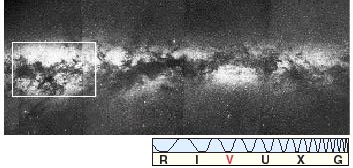
Figure 18.5 A mosaic of the plane of the Milky Way Galaxy. Photographed almost from horizon to horizon, and thus extending over nearly 180°, this band contains high concentrations of stars as well as interstellar gas and dust. The field of view is several times wider than that of Figure 18.1, whose outline is superimposed on this image.
Figure 18.6 shows a 12°-wide swath of the galactic plane in the general direction of the constellation Sagittarius, as photographed from Earth. The field of view is mottled with stars and interstellar matter. In addition, several large fuzzy patches of light are clearly visible. These fuzzy objects, labeled M8, M16, M17, and M20, correspond to the eighth, sixteenth, seventeenth, and twentieth objects in a catalog compiled by Charles Messier, an eighteenth-century French astronomer.
*(Messier was actually more concerned with making a list of celestial objects that might possibly be confused with comets, his main astronomical interest. However, the catalog of 109 "Messier objects" is now regarded as a much more important contribution to astronomy than any comets Messier discovered.)
Today they are known as emission nebulae—glowing clouds of hot interstellar matter.
Figure 18.6 A photograph of a small portion (about 12° across) of the Galactic plane shown in Figure 18.1, displaying higher—resolution evidence for stars, gas, and dust as well as several distinct fuzzy patches of light, known as emission nebulae. The plane of the Milky Way Galaxy is marked with a dashed line.
Figure 18.7 An enlargement of the bottom of Figure 18.6, showing M20 (top) and M8 (bottom) more clearly.
Figure 18.8 Further enlargements of the top of Figure 18.7, showing only M20 and its interstellar environment. The nebula itself (in red) is about 4 pc in diameter. It is often called the Trifid Nebula because of the dust lanes that trisect its midsection (insert). The blue region is unrelated to the red emission nebula and is caused by starlight reflected from intervening dust particles. It is called a reflection nebula.
Historically, astronomers used the term nebula to refer to any "fuzzy" patch (bright or dark) on the sky—any region of space that was clearly distinguishable through a telescope but not sharply defined, unlike a star or a planet. We now know that many (though not all) nebulae are clouds of interstellar dust and gas. If they happen to obscure stars lying behind them, we see a dark patch. If something within the cloud—a group of hot young stars, for example—causes it to glow, the nebula appears bright instead. The method of spectroscopic parallax applied to stars visible within the emission nebulae shown in Figure 18.6 indicates that their distances from Earth range from 900 pc (M20) to 1800 pc (M16).  (Sec. 17.8) Thus, all four are near the limit of visibility for any object embedded in the dusty Galactic plane. M16, at the top left, is approximately 1000 pc from M20, near the bottom.
We can gain a better appreciation of these nebulae by examining progressively smaller fields of view. Figure 18.7 is an enlargement of the region near the bottom of Figure 18.6, showing M20 at the top and M8 at the bottom, only a few degrees away. Figure 18.8 is another enlargement of the top of Figure 18.7, presenting a close-up of M20 and its immediate environment. The total area of the close-up view displayed measures some 10 pc across. Emission nebulae are among the most spectacular objects in the entire universe, yet they appear only as small, undistinguished patches of light when viewed in the larger context of the Milky Way, as in Figure 18.5. Perspective is crucial in astronomy.
These nebulae are regions of glowing, ionized gas. At or near the center of each is at least one newly formed hot O or B star producing copious amounts of ultraviolet light. As ultraviolet photons travel outward from the star they ionize the surrounding gas. As electrons recombine with nuclei they emit visible radiation, causing the gas to glow. Figure 18.9 shows enlargements of two of the other nebulae visible in Figure 18.6. Notice the predominant red coloration of the emitted radiation and the hot bright stars embedded within the glowing nebular gas.
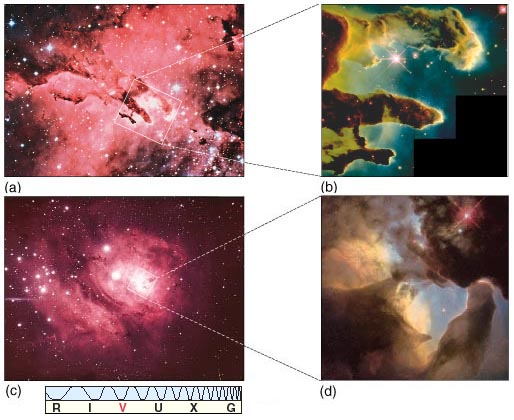
Figure 18.9 Enlargements of selected portions of Figure 18.8. (a) M16, the Eagle Nebula. (b) A Hubble image of huge columns of cold gas and dust inside M16, delicate sculptures created by the action of stellar ultraviolet radiation on the original cloud. In this image, green represents emission from hydrogen atoms, red, emission from singly ionized sulfur, and blue, emission from doubly ionized oxygen. (c) M8, the Lagoon Nebula. (d) A high-resolution view of the core of M8, a region known as the Hourglass. Notice in all cases the irregular shape of the emitting regions, the characteristic red color of the light, the bright stars within the gas, and the patches of obscuring dust.
|
|
|
The interaction between stars and gas is particularly striking in Figure 18.9(b). The three dark pillars visible in this spectacular Hubble Space Telescope image are part of the interstellar cloud from which the stars formed. The rest of the cloud in the vicinity of the new stars has already been dispersed by their radiation, in a process known as photoevaporation; the fuzz around the edges of the pillars, especially at top right and center, is the result of this process. As photoevaporation continues, it eats away the less dense material first, leaving behind delicate sculptures composed of the denser parts of the original cloud, just as wind and water create spectacular structures in Earth's deserts and shores by eroding away the softest rock. The process is a dynamic one—the pillars will eventually be destroyed, but probably not for another hundred thousand or so years.
The reddish hue of these nebulae—and in fact of all emission nebula—results when hydrogen atoms emit light in the red part of the visible spectrum. Specifically, it is caused by the emission of radiation at 656.3 nm—the H line discussed in Chapter 4. (Sec. 4.2) Other elements in the nebula also emit radiation as their electrons recombine, but because hydrogen is so plentiful, its emission usually dominates.
Woven through the glowing nebular gas, and plainly visible in Figures 18.7-18.9, are lanes of dark obscuring dust. Recent studies have demonstrated that these dust lanes are part of the nebulae and are not just unrelated dust clouds that happen to lie along our line of sight. This relationship is particularly evident in Figures 18.9(b) and (d), where regions of gas and dust are simultaneously silhouetted against background nebular emission and illuminated by foreground nebular stars.
Spectroscopists often refer to the ionization state of an atom by attaching a roman numeral to its chemical symbol—I for the neutral atom, II for a singly ionized atom (missing one electron), III for a doubly ionized atom (missing two electrons), and so on. Because emission nebulae are composed mainly of ionized hydrogen, they are often referred to as HII regions. Regions of space containing primarily neutral (atomic) hydrogen are known as HI regions.
Most of the photons emitted by the recombination of electrons with atomic nuclei escape from the nebula. Unlike the ultraviolet photons originally emitted by the embedded stars, they do not carry enough energy to ionize the nebular gas, and they pass through the nebula relatively unhindered. Some eventually reach Earth, where we can detect them. Only through these lower-energy photons do we learn anything about emission nebulae.
Nebular spectra tell us a great deal about ionized interstellar gas. Because at least one hot star resides near the center of the nebula, we might think that the combined spectrum of the star and the nebula would be hopelessly confused. In fact, they are not. We can easily distinguish nebular spectra from stellar spectra because the physical conditions in stars and nebulae differ so greatly. In particular, emission nebulae are made of hot thin gas that, as we saw in Chapter 4, yields detectable emission lines. (Sec. 4.2) When our spectroscope is trained on a star, we see a familiar stellar spectrum, consisting of a blackbody-like continuous spectrum and absorption lines, together with superimposed emission lines from the nebular gas. When no star appears in the field of view, only the emission lines are seen.
Figure 18.10(b) is a typical nebular emission spectrum spanning part of the visible and near—ultraviolet wavelength interval. Numerous emission lines can be seen, and information on the nebula shown in Figure 18.10a can be extracted from all of them. The results of analyses of many nebular spectra show abundances close to those derived from observations of the Sun and other stars and elsewhere in the interstellar medium: hydrogen is about 90 percent abundant by number, followed by helium at about 9 percent; the heavier elements together make up the remaining 1 percent.
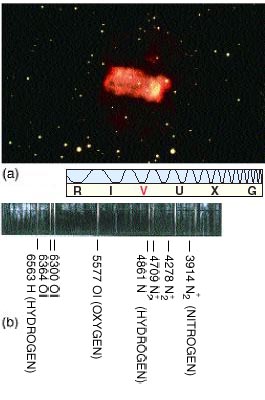
Figure 18.10 (a) The Butterfly Nebula, a glowing patch of gas a few parsecs across. (b) Its emission spectrum, showing light intensity over the entire visible portion of the electromagnetic spectrum from red to deep violet.
Unlike stars, nebulae are large enough for their actual sizes to be measurable by simple geometry. Coupling this size information with estimates of the amount of matter along our line of sight (as revealed by the nebula's total emission of light), we can find the nebula's density. Generally, emission nebulae have only a few hundred particles, mostly protons and electrons, in each cubic centimeter—a density some 1022 times lower than that of a typical planet. Spectral—line widths imply that the gas atoms and ions have temperatures around 8000 K. ( Sec. 4.4) Table 18.1 lists some vital statistics for each of the nebulae shown in Figure 18.6.
| TABLE 18.1 Some Nebular Properties | ||||||||||||||||||||||||||||||
|
When astronomers first studied the spectra of emission nebulae, they found many lines that did not correspond to anything observed in terrestrial laboratories. For example, in addition to the dominant red coloration just discussed, many nebulae also emit light with a characteristic green color (see Figure 18.11). The greenish tint of portions of this nebula puzzled astronomers in the early twentieth century and defied explanation in terms of the spectral lines known at the time, prompting speculation that the nebulae contained elements unknown on Earth. Some scientists even went so far as to invent the term "nebulium" for a new element, much as the name helium came about when that element was first discovered in the Sun (recall also "coronium" from Chapter 16). (Sec. 16.3)
Figure 18.11 (a) The Orion Nebula (M42) lies some 450 pc from Earth. It is visible to the naked eye as the fuzzy middle "star" of Orion's sword. (b) Like all emission nebulae, it consists of hot, glowing gas powered by a group of bright stars in the center. In addition to the red Hemission, parts of the nebula show a slight greenish tint, caused by a so-called forbidden transition in ionized oxygen. (c) A high-resolution, approximately true-color image shows rich detail in a region about a 0.5 light year across. Structural details are visible down to a level of 0.1" , or 6 light hours—a scale comparable to our solar system.
Later, with a fuller understanding of the workings of the atom, astronomers realized that these lines did in fact result from electron transitions within the atoms of familiar elements, but occurring under unfamiliar conditions not reproducible in laboratories. Astronomers now understand that the greenish tint in Figure 18.11(b) and (c) is caused by a particular electron transition in doubly ionized oxygen. However, the structure of oxygen is such that an ion in the higher-energy state for this transition tends to remain there for a very long time—many hours, in fact—before dropping back to the lower state and emitting a photon. Only if the ion is left undisturbed during this time, and not kicked into another energy state, will the transition actually occur and the photon be emitted.
In a terrestrial experiment no atom or ion is left undisturbed for long. Even in a "low—density" laboratory gas, there are many trillions of particles per cubic meter, and each particle experiences millions of collisions every second. The result is that an ion in the particular energy state that produces the peculiar green line in the nebular spectrum never has time to emit its photon in the lab—collisions kick it into some other state long before that occurs. For this reason the line is usually called forbidden, even though it violates no laws of physics. It simply occurs on Earth with such low probability that it is never seen.
In an emission nebula the density is so low that collisions between particles are very rare. There is plenty of time for the excited ion to emit its photon, so the forbidden line is produced. Numerous forbidden lines are known in nebular spectra. They remind us once again that the environment in the interstellar medium is very different from conditions on Earth and warn us of the problems of extending our terrestrial experience to the study of interstellar space.