Now let's turn our attention to the large-scale motions of galaxies and galaxy clusters. Within a galaxy cluster, individual galaxies move in essentially random ways. You might expect that, on the largest possible scales, the clusters themselves would also have random, disordered motion—some clusters moving this way, some that. This is not the case at all, however. On the largest scales, galaxies that are not members of a cluster, and galaxy clusters alike, display very ordered motion.
In 1912 the American astronomer Vesto M. Slipher, working under the direction of Percival Lowell, discovered that virtually every spiral galaxy he observed had a redshifted spectrum—it was apparently receding from our Galaxy. In fact, with the exception of a few nearby systems, every known galaxy is part of a general motion away from us in all directions. Individual galaxies that are not part of galaxy clusters are steadily receding. Galaxy clusters too have an overall recessional motion, although their individual member galaxies move randomly with respect to one another. (Consider a jar full of fireflies that has been thrown into the air. The fireflies within the jar, like the galaxies within the cluster, have random motions due to their individual whims, but the jar as a whole, like the galaxy cluster, has some directed motion as well.)
Figure 24.30 shows the optical spectra of several galaxies, arranged in order of increasing distance from the Milky Way Galaxy. These spectra are redshifted, indicating that the galaxies are steadily receding. Furthermore, the extent of the redshift increases progressively from top to bottom in the figure. Because the galaxies' distances from us also increase from top to bottom, we conclude that there is a connection between Doppler shift and distance: the greater the distance, the greater the redshift. This trend holds for nearly all galaxies in the universe. (Two galaxies within our Local Group, including Andromeda, and a few galaxies in the Virgo Cluster display blueshifts and so have some motion toward us, but this results from their random motions within their parent clusters. Recall the fireflies in the jar.)
Figure 24.30 Optical spectra (on the left) of several galaxies (on the right). Both the extent of the redshift (denoted by the horizontal yellow arrows) and the distance from the Milky Way Galaxy to each galaxy (numbers in center column) increase from top to bottom. The vertical yellow arrow in the top spectrum highlights a particular spectral feature (a pair of dark absorption lines). The horizontal yellow arrows indicate how this feature shifts to longer wavelengths in spectra of more distant galaxies. The lines at top and bottom of each spectrum are laboratory references.
Figure 24.31(a) shows recessional velocity plotted versus distance for the galaxies of Figure 24.30. Figure 24.31(b) is a similar plot for some more galaxies within about 1 billion pc of Earth. Plots like these were first made by Edwin Hubble in the 1920s and now bear his name—Hubble diagrams. The data points generally fall close to a straight line, indicating that a simple relationship connects recessional velocity and distance: the rate at which a galaxy recedes is directly proportional to its distance from us. This rule is called Hubble's law. We could construct such a diagram for any group of galaxies, provided we could determine their distances and velocities. The universal recession described by the Hubble diagram is sometimes called the Hubble flow.

Figure 24.31 Plots of recessional velocity versus distance (a) for the galaxies shown in Figure 24.30 and (b) for numerous other galaxies within about 1 billion pc of Earth.
To distinguish recessional redshift from redshifts caused by motion within an object—for example, galaxy orbits within a cluster or explosive events in a galactic nucleus—the redshift resulting from the Hubble flow is called the cosmological redshift. Objects that lie so far away that they exhibit a large cosmological redshift are said to be at cosmological distances—distances comparable to the scale of the universe.
Hubble's law is an empirical discovery—that is, a discovery based strictly on observational results. Its central relationship—a statistical correlation between recessional velocity and distance—is well documented as far as galaxy distances can be reliably determined, but no law of nature demands that all galaxies recede, and no law of physics requires that a link exist between velocity and distance. In that sense, Hubble's "law" is not really a law at all. It is simply a convenient way of noting the observational fact that any galaxy's recessional velocity is directly proportional to its distance from us.
The recessional motions of the galaxies prove that the cosmos is not steady and unchanging on the largest scales. Its contents are in constant relative motion, and the motion is not random. The universe is expanding—and expanding in an ordered fashion. In short, it is evolving. Before going any further, however, let's be clear on what is expanding and what is not. Hubble's law does not mean that humans, Earth, the solar system, or even individual galaxies are physically increasing in size. These groups of atoms, rocks, planets, and stars are held together by their own internal forces and are not themselves getting bigger. Only the largest framework of the universe—the ever-increasing distances separating the galaxies and the galaxy clusters—is expanding.
Hubble's law has some fairly obvious and dramatic implications. If nearly all galaxies show recessional velocity according to Hubble's law, then doesn't that mean that they all started their journey from a single point? If we could run time backward, wouldn't all the galaxies fly back to this one point, perhaps the site of some explosion in the remote past? The answer is yes. In Chapters 26 and 27 we explore the ramifications of the Hubble flow for the past and future evolution of our universe. For the remainder of this chapter, however, we set aside its cosmic implications and use Hubble's law simply as a convenient distance-measuring tool.
The constant of proportionality between recessional velocity and distance in Hubble's law is known as Hubble's constant. It is usually denoted by the symbol H0. The data shown in Figure 24.31 then obey the equation

The value of Hubble's constant is the slope of the straight line—recessional velocity divided by distance—in Figure 24.31(b). Reading the numbers off the graph, this value comes to roughly 65,000 km/s divided by 1000 Mpc, or 65 km/s/Mpc (kilometers per second per megaparsec, the most commonly used unit for H0). Astronomers continually strive to refine the accuracy of the Hubble diagram and the resulting estimate of H0 because Hubble's constant is one of the most fundamental quantities of nature—it specifies the rate of expansion of the entire cosmos.
The precise value of Hubble's constant is still the subject of considerable debate. In the 1970s, astronomers obtained a value of around 50 km/s/Mpc, using a chain of standard candles to extend their observations to large distances. However, in the early 1980s, after the Tully—Fisher technique had become fairly well established, other researchers used it to obtain a measurement of H0 that was largely independent of methods relying on standard candles. From observations of galaxies within about 150 Mpc, the latter group deduced a value of H0 ![]() = 90 km/s/Mpc, a result inconsistent with the earlier measurements (even allowing for the estimated uncertainties involved). For some reason, the distances obtained using the Tully—Fisher method were only about half those determined by using standard candles, so the measured value of Hubble's constant nearly doubled using this approach.
= 90 km/s/Mpc, a result inconsistent with the earlier measurements (even allowing for the estimated uncertainties involved). For some reason, the distances obtained using the Tully—Fisher method were only about half those determined by using standard candles, so the measured value of Hubble's constant nearly doubled using this approach.
Subsequent determinations of H0 by other researchers, using different galaxies and a variety of distance-measurement techniques, have yielded results mostly within the range 45—90 km/s/Mpc, and most astronomers would be quite surprised if the true value of H0 turned out to lie outside this range. The recent revision to the cosmic distance scale by the Hipparcos mission, by increasing our distance estimates, has correspondingly decreased the measured value of H0. (Interlude 17-1) We will adopt H0 = 65 km/s/Mpc as the best current estimate of Hubble's constant for the remainder of the text, but you should bear in mind that there is still considerable uncertainty—and debate—among astronomers as to the true value of this very important number. (The distances in Figures 24.30 and 24.31 are based on older observations, but they have been adjusted to reflect the new Hipparcos findings.)
One very important application of Hubble's law is its use as a means of determining distances. Using Hubble's law, we can derive the distance to a remote object simply by measuring the object's recessional velocity. An astronomer measures the redshift of the object's spectral lines. The extent of the shift is then converted to velocity, using the Doppler relationship discussed in Chapter 3.  (Sec. 3.5) Knowing the object's velocity, the astronomer then finds its distance by using the plot of Figure 24.31(b). Notice, however, that the uncertainty in Hubble's constant translates directly into a similar uncertainty in the distance determined by this method.
Using Hubble's law in this way tops our inverted pyramid of distance-measurement techniques (Figure 24.32). This sixth method simply assumes that Hubble's law holds. If this assumption is correct, Hubble's law enables us to measure great distances in the universe—so long as we can obtain an object's spectrum, we can determine how far away the object is.
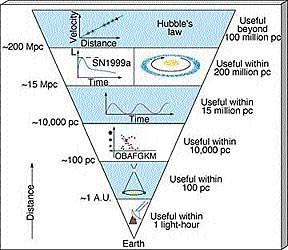
Figure 24.32 Hubble's law tops the hierarchy of distance-measurement techniques. It is used to find the distances of astronomical objects all the way out to the limits of the observable universe.
Many redshifted objects have recessional motions that are a substantial fraction of the speed of light. The most distant object thus far observed in the universe has the catalog name 0140 + 326RD1. Its extremely high redshift implies a recessional velocity 95 percent that of light. At that speed, ultraviolet spectral lines are Doppler shifted all the way into the far infrared! Hubble's law implies that, solely on the basis of its observed redshift, 0140 + 326RD1 lies some 5500 Mpc away from us (see More Precisely 25-1). This object resides as close to the limits of the observable universe as astronomers have yet been able to probe.
The speed of light is finite. It takes time for light or any kind of radiation to travel from one point in space to another. The radiation that we now see from distant objects originated long ago. Incredibly, the radiation that astronomers now detect from 0140 + 326RD1 left that object almost 9.5 billion years ago, well before our planet, our Sun, and perhaps even our Galaxy came into being. (See again More Precisely 25-1 for reconciliation of this time with the present distance of 18 billion light years implied by the previous paragraph.)
 Using Hubble's law, we can complete our census of the large-scale distribution of galaxies. One of the most extensive surveys of the universe yet undertaken has been carried out by astronomers at Harvard University. Using Hubble's law as their distance indicator, these researchers are compiling a catalog of the positions and redshifts of all galaxies within about 250 Mpc of our Galaxy. This is an extremely painstaking task—even with a large telescope, it takes a long time to obtain a detailed spectrum of a distant galaxy. Rather than trying to cover the entire sky at once, the team elected to map the universe in a series of wedge-shaped "slices," each 6 ° thick, starting in the northern sky. The first slice, shown in Figure 24.33, covered a region of the sky containing the Coma Cluster (Figure 24.1), which happens to lie in a direction almost perpendicular to our Galaxy's plane.
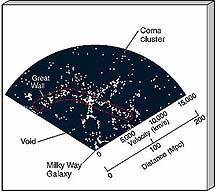
Figure 24.33 The first slice of a survey of the universe, covering 1057 galaxies out to an approximate distance of 200 Mpc, clearly shows that galaxies and clusters are not randomly distributed on large scales. Instead, they appear to have a filamentary structure, surrounding vast, nearly empty voids. The distances shown assume H0 = 65 km/s/Mpc.
The most striking feature of maps such as this is that the distribution of galaxies on very large scales is decidedly nonrandom. The galaxies appear to be arranged in a network of strings, or filaments, surrounding large, relatively empty regions of space known as voids. The biggest voids measure some 100 Mpc across. For a time they were the largest objects in the universe known to astronomers. The most likely explanation for the voids and filamentary structure in Figure 24.33 is that the galaxies and galaxy clusters are spread across the surfaces of vast "bubbles" in space. The voids are the interiors of these gigantic bubbles. The galaxies seem to be distributed like beads on strings only because of the way our slice of the universe cuts through the bubbles. Like suds on soapy water, these bubbles fill the entire universe. The densest clusters and superclusters lie in regions where several bubbles meet.
The notion that the filaments are just the intersection of the survey slice with much larger structures (the bubble surfaces) was confirmed when the next three slices of the survey, lying above and below the first, were completed. The region of Figure 24.33 indicated by the red outline was found to continue through both the other slices, so we know that it covers at least 36 ° on the sky perpendicular to the outline in the figure. This extended sheet of galaxies, which has come to be known as the Great Wall, measures at least 70 Mpc (out of the plane of the page) by 200 Mpc (across the page). For now at least, it is one of the largest known structures in the universe. Figure 24.34 combines all the available data with results of other surveys of the southern sky. (The large empty regions are either obscured by our Galaxy or not yet mapped.) The Great Wall can be seen arcing around the left side of the figure.

Figure 24.34 Combination of data from several redshift surveys of the universe reveal the extent of large-scale structure within 200—300 Mpc of the Sun. The arc on the left is the Great Wall. The empty regions are mostly areas obscured by our Galaxy. Positions for more than 4500 galaxies are plotted here. We assume H0 = 65 km/s/Mpc.
For a time, theorists tried to explain voids as gigantic cavities hollowed out by the explosions of extremely massive stars early in the history of the universe, but this explanation does not work. The energy requirements would have been just too great, and the explosions would have had other observable consequences (mostly related to the radiation they would have released) that simply are not seen. Instead, most theorists now believe that all structure on scales larger than a few megaparsecs traces its origin directly to the conditions found in the very earliest stages of the universe (Chapter 27). As such, these studies of large-scale structure may be vital to our efforts to understand the origin and nature of the cosmos itself.
Are there still larger structures in the universe? Only with more extensive surveys will we know for sure. All large-scale surveys performed to date have detected structures comparable in size to the region surveyed—in other words, they have found objects as large as the largest object they could have hoped to find. Observers and theorists alike are eager to find out how much farther this trend will continue. With several new larger-scale surveys nearing completion, some answers may be in hand early in the 21st century.