The evolutionary stages we have just described are derived from numerical experiments performed on high-speed computers. Table 19.1 and the evolutionary paths described in Figures 19.4, 19.6, and 19.7 are mathematical predictions of a multifaceted problem incorporating gravity, heat, rotation, magnetism, nuclear reaction rates, elemental abundances, and other physical conditions specifying the state of contracting interstellar clouds. Computer technology has enabled theorists to construct these models, but their accuracy is only partly known, in large part because it is difficult to test them observationally.
How then can we verify the theoretical predictions just outlined? The age of our entire civilization is much shorter than the time needed for a cloud to contract and form a star. We can never observe individual objects proceed through the full panorama of star birth. We can, however, observe many different objects—interstellar clouds, protostars, young stars approaching the main sequence—as they appear today at different stages of their evolutionary paths. Each observation is like part of a jigsaw puzzle. When properly oriented relative to all the others, the pieces can be used to build up a picture of the full life cycle of a star.
Prestellar objects at stages 1 and 2 are not yet hot enough to emit much infrared radiation, and certainly no optical radiation arises from their dark, cool interiors. The best way to study the early stages of cloud contraction and fragmentation is to observe the radio emission from interstellar molecules within these clouds. Consider again M20, the splendid emission nebula studied in Chapter 18.  (Sec. 18.2) The brilliant region of glowing, ionized gas shown in Figure 18.8 is not our main interest here, however. Instead, the youthful O- and B-type stars that energize the nebula alert us to the general environment where stars are forming. Emission nebulae are signposts of star birth.
The region surrounding M20 contains galactic matter that seems to be contracting. The presence of (optically) invisible gas there was illustrated in Figure 18.20, which showed a contour map of the abundance of the formaldehyde (H2CO) molecule. Formaldehyde and many other molecules are widespread in the vicinity of the nebula, especially throughout the dusty regions below and to the right of the emission nebula itself. Further analysis of the observations suggests that this region of greatest molecular abundance is also contracting and fragmenting, well on its way toward forming a star—or, more likely, a star cluster.
The interstellar clouds in and around M20 thus provide tentative evidence of three distinct phases of star formation, as shown in Figure 19.8. The huge, dark molecular cloud surrounding the visible nebula is the stage 1 cloud. Both its density and its temperature are low, about 108 particles/m3 and 20 K, respectively. Greater densities and temperatures typify smaller regions within this huge cloud. The totally obscured regions labeled A and B, where the molecular emission of radio energy is strongest, are such denser, warmer fragments. Here, the total gas density is observed to be at least 109 particles/m3, and the temperature is about 100 K. The Doppler shifts of the radio lines observed in the vicinity of region B indicate that this portion of M20, labeled "contracting fragment" in Figure 19.8, is contracting. Less than a light year across, this region has a total mass over 1000 times the mass of the Sun—considerably more than the mass of M20 itself. It lies somewhere between stages 1 and 2 of Table 19.1.
Figure 19.8 The M20 region shows observational evidence for three broad phases in the birth of a star: (1) the parent cloud (stage 1 of Table 19.1), (2) a contracting fragment (between stages 1 and 2), and (3) the emission nebula (M20 itself) resulting from the formation of one or more massive stars (stages 6 and 7).
The third star-formation phase shown in Figure 19.8 is M20 itself. The glowing region of ionized gas results directly from a massive O-type star that formed there within the past million years or so. Because the central star is already fully formed, this final phase corresponds to stage 6 or 7 of our evolutionary scenario.
Other parts of our Milky Way Galaxy provide sketchy evidence for prestellar objects in stages 3 through 5. The Orion complex, shown in Figure 19.9, is one such region. Lit from within by several O-type stars, the bright Orion Nebula is partly surrounded by a vast molecular cloud that extends well beyond the roughly 2 ![]() 3 pc region bounded by the photograph in Figure 19.9(b).
3 pc region bounded by the photograph in Figure 19.9(b).
Figure 19.9 (a) The constellation Orion, with the region around its famous emission nebula marked by a rectangle. The Orion Nebula is the middle "star" of Orion's sword. The framed region is enlarged in part (b), suggesting how the nebula is partly surrounded by a vast molecular cloud. Various parts of this cloud are probably fragmenting and contracting, with even smaller sites forming protostars. The three frames at right show some of the evidence for those protostars. (c) A false-color radio image of some intensely emitting molecular sites. (d) A nearly real color visible image of embedded nebular "knots" thought to harbor protostars. (e) A high-resolution image of several young stars surrounded by disks of gas and dust where planets might ultimately form.
The Orion molecular cloud harbors several smaller sites of intense radiation emitted by molecules deep within the core of the cloud fragment. Their extent, shown in Figures 19.9(c) and (e) measures about 1010 km, or 1/1000 of a light year, about the diameter of our solar system. The gas density of these smaller regions is about 1015 particles/m3, much denser than the surrounding cloud. Although their temperature cannot be estimated reliably, many researchers regard these regions as objects well on their way to stage 3. We cannot determine if these regions will eventually form stars like the Sun, but it does seem certain that these intensely emitting regions are on the threshold of becoming protostars.
In the hunt for and study of objects at more advanced stages of star formation, radio techniques become less useful because stages 4, 5, and 6 have increasingly higher temperatures. By Wien's law, their emission shifts toward shorter wavelengths, and so these objects shine most strongly in the infrared. (Sec. 3.4) One particularly bright infrared emitter, known as the Becklin—Neugebauer object (see Figure 19.17c), was detected in the core of the Orion molecular cloud in the 1970s. Its luminosity is around 1000 times the luminosity of the Sun. Most astronomers agree that this warm, dense blob is a high-mass protostar, probably around stage 4.
Until the Infrared Astronomy Satellite was launched in the early 1980s, astronomers were aware only of giant stars forming in clouds far away. But IRAS showed that stars are forming much closer to home, and some of these protostars have masses comparable to that of our Sun. Figure 19.10 shows the premier example of a solar-mass protostar—Barnard 5. Its infrared heat signature is that expected of an object on the Hayashi track, around stage 5.
Figure 19.10 An infrared image of the nearby region containing the source Barnard 5 (indicated by the arrow). On the basis of its temperature and luminosity, Barnard 5 appears to be a protostar on the Hayashi track in the H—R diagram.
The energy sources for some infrared objects seem to be luminous hot stars that are hidden from optical view by surrounding dark clouds. Apparently, some of the stars are already so hot that they emit large amounts of ultraviolet radiation, which is mostly absorbed by a "cocoon" of dust surrounding the central star. The absorbed energy is then reemitted by the dust as infrared radiation. These bright infrared sources are known as cocoon nebulae. Two considerations support the idea that the hot stars responsible for the clouds' heating have only recently ignited: (1) These dust cocoons are predicted to disperse quite rapidly once their central stars form, and (2) they are invariably found in the dense cores of molecular clouds. The central stars probably lie near stage 6.
Protostars often exhibit strong winds. Radio and infrared observations of hydrogen and carbon monoxide molecules, again in the Orion cloud, have revealed gas expanding outward at velocities approaching 100 km/s. High-resolution interferometric observations have disclosed expanding knots of water emission within the same star-forming region and have linked the strong winds to the protostars themselves. These winds may be related to the violent surface activity associated with many protostars.
Early in a protostar's life it may still be embedded in an extensive disk of nebular material in which planets are forming. (Sec. 15.2) When the protostellar wind begins to blow, it encounters less resistance in the directions perpendicular to the disk than in the plane of the disk. The result is known as a bipolar flow—two "jets" of matter are expelled in the directions of the poles of the protostar, as illustrated in Figure 19.11. As the protostellar wind gradually destroys the disk, blowing it away into space, the jets widen until, with the disk gone, the wind flows away from the star equally in all directions. Figure 19.12 shows a real bipolar flow, along with an artist's conception of the system producing it.
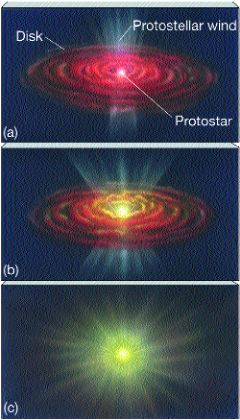
Figure 19.11 (a) When a protostellar wind encounters the disk of nebular gas surrounding the protostar, it tends to form a bipolar jet, preferentially leaving the system along the line of least resistance, which is perpendicular to the disk. (b) As the disk is blown away by the wind the jets fan out, eventually (c) merging into a spherical wind.
Figure 19.12 (a) This false-color radio image shows two jets emanating from the young star system HH81-82 (whose position is marked with a cross at center). This is the largest stellar jet known, with a length of about 10,000 A.U. (The colors are coded in order of decreasing radio intensity: red, blue, green.) (b) An idealized artist's conception of a young star system, showing two jets flowing perpendicular to the disk of gas and dust rotating around the star. (See also the chapter-opening photos of more stellar jets.)