Looking at the night sky, you can tell at a glance which stars are hot and which are cool. In Figure 17.10, which shows the constellation Orion as it appears through a small telescope, the colors of the cool red star Betelgeuse and the hot blue star Rigel are clearly evident. (Note, by the way, that these colors are intrinsic properties of the stars, and have nothing to do with Doppler redshifts or blueshifts.) However, to obtain these stars' temperatures (3000 K for Betelgeuse and 15,000 K for Rigel), more detailed observations are required.

Figure 17.10 The constellation Orion, as it would appear through a small telescope or binoculars. The different colors of the member stars are easily distinguished. The bright red star at the upper left is Betelgeuse ( ); the bright blue-white star at the lower right is Rigel (
 ). (Compare with Figure 1.6.) The scale of the photograph is about 3° across.
Astronomers can determine a star's surface ("effective") temperature by measuring its apparent brightness (radiation intensity) at several frequencies, then matching the observations to the appropriate blackbody curve.  (Sec. 3.4) In the case of the Sun, the theoretical curve that best fits the emission describes a 5800-K emitter. (Sec. 16.1) The same technique works for any other star, regardless of its distance from Earth.
Because the basic shape of the blackbody curve is so well understood, astronomers can estimate a star's temperature using as few as two measurements at selected wavelengths (which is fortunate, as detailed spectra of faint stars are often difficult and time consuming to obtain). This is accomplished through the use of telescope filters that block out all radiation except that within specific wavelength ranges. For example, a B (blue) filter rejects all radiation except for a certain range of violet to blue light. Defined by international agreement to extend from 380 to 480 nm, this range corresponds to wavelengths to which photographic film happens to be most sensitive. Similarly, a V (visual) filter passes only radiation within the 490 to 590 nm range (green to yellow), corresponding to that part of the spectrum to which human eyes are particularly sensitive. Many other filters are also in routine use—a U (ultraviolet) filter covers the near ultraviolet, and infrared filters span longer-wavelength parts of the spectrum.
Figure 17.11 shows how the B and V filters admit different amounts of light for objects of different temperatures. In curve (a), corresponding to a very hot 30,000-K emitter, considerably more radiation (about twice as much) is received through the B filter than through the V filter. In curve (b), the temperature is 10,000 K, and the B and V intensities are about the same. In the cool 3000-K curve (c), about five times more energy is received in the V range than in the B range. In each case, it is possible to reconstruct the entire blackbody curve on the basis of only those two measurements because no other blackbody curve can be drawn through both measured points. To the extent that a star's spectrum is well approximated as a blackbody, measurements of the B and V intensities are enough to specify the star's blackbody curve and thus yield its surface temperature. Operationally, astronomers go about determining a star's temperature by measuring its color index (often referred to simply as the "color"), defined as the ratio of its B to V intensities (or, equivalently, the difference between the star's apparent magnitudes measured through the B and V filters). Table 17.1 lists a more detailed description of the color index, the surface temperature derived from it, the dominant color perceived in the absence of filters, and some stellar examples. This type of non-spectral-line analysis, in which a star's intensity is measured through each of a set of standard filters, is known as photometry (literally meaning "light measurement").
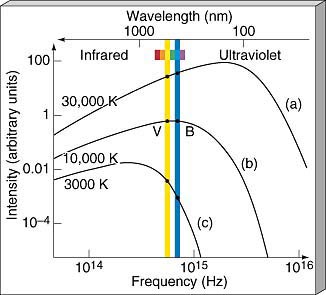
Figure 17.11 Blackbody curves for three different temperatures, along with the locations of the B (blue) and V (visual) filters. Star (a) is very hot—30,000 K—so its B intensity is considerably greater than its V intensity. Star (b) has about the same B and V readings and appears white. Its temperature is about 10,000 K. Star (c) is red. Its V intensity greatly exceeds the B value, and its temperature is 3000 K.
| TABLE 17.1 Stellar Colors and Temperatures | ||||||||||||||||||||||||||||||||||||||||||
|
||||||||||||||||||||||||||||||||||||||||||