Astronomers can use color and temperature to classify stars reasonably well, but they often use a more detailed classification scheme. This scheme incorporates additional knowledge of stellar physics obtained through spectroscopy, the study of spectral-line radiation.
Figure 17.12 compares the spectra of several different stars, arranged in order of decreasing surface temperature (as determined from measurements of their colors). All the spectra extend from 400 to 700 nm, and each shows a series of dark absorption lines superimposed on a background of continuous color, like those of the Sun.  (Sec. 16.3) However, the precise patterns of lines show many differences. Some stars display strong lines in the long-wavelength part of the spectrum (to the left in Figure 17.10). Other stars have their strongest lines at short wavelengths (to the right). Still others show strong absorption lines spread across the whole visible spectrum. What do these differences tell us?
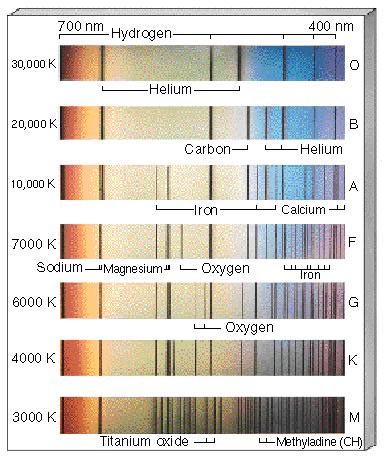
Figure 17.12 Comparison of spectra observed for seven different stars having a range of surface temperatures. The hottest stars, at the top, show lines of helium and multiply ionized heavy elements. In the coolest stars, at the bottom, helium lines are not seen, but lines of neutral atoms and molecules are plentiful. At intermediate temperatures, hydrogen lines are strongest. The actual compositions of all seven stars are about the same.
Although spectral lines of many elements are present with widely varying strengths, the differences among the spectra in Figure 17.12 are not due to differences in composition. Detailed spectral analysis indicates that the seven stars shown have very similar elemental abundances—all are more or less solar in makeup. Instead, the differences are due almost entirely to the stars' temperatures. The spectrum at the top of Figure 17.12 is exactly what we would expect from a star with solar composition and a surface temperature of about 30,000-K, the second from a 20,000-K star, and so on, down to the 3000-K star at the bottom.
The spectra of stars with surface temperatures exceeding 25,000-K usually show strong absorption lines of singly ionized helium and multiply ionized heavier elements, such as oxygen, nitrogen, and silicon (these latter lines are not shown in the spectra of Figure 17.12). These strong lines are not seen in the spectra of cooler stars because only very hot stars can excite and ionize these tightly bound atoms. In contrast, the hydrogen absorption lines in the spectra of very hot stars are relatively weak. The reason is not a lack of hydrogen—it is by far the most abundant element in all stars. At these high temperatures, however, much of the hydrogen is ionized, so there are few intact hydrogen atoms to produce strong spectral lines. What's more, the few hydrogen atoms that have managed to retain their single electron are mostly in such highly excited states that their spectral lines are invisible. (Sec. 4.4; More Precisely 4.2)
In cooler stars, with surface temperatures of around 10,000 K, hydrogen is responsible for the strongest absorption lines. This temperature is just right for electrons to move frequently between hydrogen's second and third orbitals, producing the characteristic red H (hydrogen alpha) line at 656.3 nm (see Section 4.2, particularly Figure 4.10). Lines of tightly bound atoms—elements such as helium, oxygen, and nitrogen, which need lots of energy for excitation or ionization—are rarely observed in the spectra of 10,000-K stars, whereas lines from more loosely bound atoms—such as calcium and titanium—are fairly common.
Even cooler stars, with surface temperatures of only a few thousand kelvins, show extremely weak hydrogen lines. As with the hottest stars, cooler stars do not have much electron traffic between the second and higher orbitals in hydrogen atoms. But unlike the hottest stars, in which most hydrogen atoms are highly excited or ionized, the hydrogen lines in cool stars are weak because most of the electrons are in the ground state. The most intense lines are due to weakly excited heavy atoms; no lines from ionized elements are seen. In fact, the average energy of the photons leaving the surface of the coolest stars is less than that needed to destroy some molecules, and many of the observed absorption lines are produced by molecules rather than by atoms (note the lines of the molecules titanium oxide and methyladine at the bottom of Figure 17.12).
Stellar spectra like those shown in Figure 17.12 were obtained for many stars well before the start of the twentieth century as observatories around the world amassed spectra from stars in both hemispheres of the sky. Between 1880 and 1920, researchers correctly identified some of the observed spectral lines on the basis of comparisons between stellar lines and those obtained in the laboratory. Those workers, though, had no firm understanding of how the lines were produced. Modern atomic theory had not yet been developed, so the correct interpretation of the line strengths, as just described, was impossible at the time.
Lacking full understanding of how atoms produce spectra, early workers classified stars primarily according to their hydrogen-line intensities. They adopted an A, B, C, D,... scheme in which A stars, with the strongest hydrogen lines, were thought to have more hydrogen than did B stars, and so on. The classification extended as far as the letter P.
In the 1920s, scientists began to understand the intricacies of atomic structure and the causes of spectral lines. Astronomers quickly realized that stars could be more meaningfully classified according to their surface temperature. Instead of adopting an entirely new scheme, however, they chose to shuffle the existing alphabetical categories—those based on the strength of hydrogen lines—into a new sequence based on temperature. In the modern scheme, the hottest stars are designated O, because they have very weak absorption lines of hydrogen and were classified toward the end of the original scheme. In order of decreasing temperature, the original letters now run O, B, A, F, G, K, M. (The other letter classes have been dropped.) These stellar designations are called spectral classes (or spectral types). Use the time-honored mnemonic "Oh, Be A Fine Guy, Kiss Me" to remember them in the correct order.
Astronomers further subdivide each lettered spectral classification into 10 subdivisions, denoted by the numbers 0—9. By convention, the lower the number, the hotter the star. Thus, for example, our Sun is classified as a G2 star (a little cooler than G1 and a little hotter than G3), Vega is a type A0, Barnard's Star is M5, Betelgeuse is M2, and so on. Table 17.2 lists the main properties of each stellar spectral class for the stars presented in Table 17.1.
| TABLE 17.2 Stellar Spectral Classes | ||||||||||||||||||||||||||||||||
|
||||||||||||||||||||||||||||||||
We should not underestimate the importance of the early work in classifying stellar spectra. Even though the original classification was based on erroneous assumptions, the painstaking accumulation of large quantities of accurate data paved the way for rapid improvements in understanding once a theory came along that explained the observations.