Astronomers use luminosity and surface temperature to classify stars in much the same way that height and weight serve to classify the bulk properties of human beings. We know that people's height and weight are well correlated—tall people tend to weigh more than short ones. We might naturally wonder if the two basic stellar properties are also related in some way.
Figure 17.13 plots luminosity versus temperature for a few well-known stars. Figures of this sort are called Hertzsprung—Russell diagrams, or H—R diagrams, after Danish astronomer Ejnar Hertzsprung and U.S. astronomer Henry Norris Russell, who independently pioneered the use of such plots in the second decade of the twentieth century. The vertical scale, expressed in units of the solar luminosity (3.9 ![]() 1026 W), extends over a large range, from 10-4 to 104; the Sun appears right in the middle of the luminosity range, at a luminosity of 1. Surface temperature is plotted on the horizontal axis, although in the unconventional sense temperature increasing to the left (so that the spectral sequence O, B, A,... reads left to right). To change the horizontal scale so that temperature would increase conventionally to the right would play havoc with historical precedent.
1026 W), extends over a large range, from 10-4 to 104; the Sun appears right in the middle of the luminosity range, at a luminosity of 1. Surface temperature is plotted on the horizontal axis, although in the unconventional sense temperature increasing to the left (so that the spectral sequence O, B, A,... reads left to right). To change the horizontal scale so that temperature would increase conventionally to the right would play havoc with historical precedent.

Figure 17.13 A plot of luminosity against surface temperature (or spectral classification), known as an H—R diagram, is a useful way to compare stars. Plotted here are the data for some stars mentioned earlier in the text. The Sun, of course, has a luminosity of 1 solar unit. Its temperature, read off the bottom scale, is 5800 K—a G-type star. Similarly, the B-type star Rigel, at top left, has a temperature of about 15,000 K and a luminosity more than 10,000 times that of the Sun. The M-type star Proxima Centauri, at bottom right, has a temperature of 3000 K and a luminosity less than 1/10,000 that of the Sun.
As we have just seen, astronomers often use a star's color to measure its temperature. Indeed, the spectral classes plotted along the horizontal axis of spectral class in Figure 17.13 are equivalent to the B/V color index. Also, because astronomers commonly express a star's luminosity as an absolute magnitude, stellar magnitude instead of stellar luminosity could be plotted vertically (see More Precisely 17-1). For these reasons, many astronomers refer to diagrams such as Figure 17.13 as color—magnitude diagrams. In this book, however, we will cast our discussion strictly in terms of temperature and luminosity measurements.
The few stars plotted in Figure 17.13 give little indication of any particular connection between stellar properties. However, as Hertzsprung and Russell plotted more and more stellar temperatures and luminosities they found that a relationship does in fact exist. Stars are not uniformly scattered across the H—R diagram. Instead, most are confined to a fairly well defined band stretching diagonally from top left (high-temperature, high-luminosity) to bottom right (low-temperature, low-luminosity). In other words, cool stars tend to be faint (less luminous) and hot stars tend to be bright (more luminous). This band of stars spanning the H—R diagram is known as the main sequence.
Figure 17.14 shows a more systematic study of stellar properties, covering the 80 or so stars that lie within 5 pc of the Sun. As more points are included in the diagram the main sequence "fills up," and the pattern becomes more evident. The vast majority of stars in the immediate vicinity of the Sun lie on the main sequence.
Figure 17.14 Most stars have properties within the shaded region known as the main sequence. The points plotted here are for stars lying within about 5 pc of the Sun. The diagonal lines correspond to constant stellar radius, so that stellar size can be represented on the same diagram as luminosity and temperature. (Recall that  stands for the Sun.)
The surface temperatures of main sequence stars range from about 3000 K (spectral class M) to over 30,000 K (spectral class O). This relatively small temperature range—only a factor of 10—is determined mainly by the rates at which nuclear reactions occur in stellar cores. In contrast, the observed range in luminosities is very large, covering some eight orders of magnitude (that is, a factor of 100 million) and ranging from 10-4 to 104 times the luminosity of the Sun.
Astronomers can use the radius—luminosity—temperature relationship (L ![]() R2T4; Section 17.3) to estimate the radii (R) of main-sequence stars from their temperatures (T) and luminosities (L). They find that in order to account for the observed range in luminosities, stellar radii must also vary along the main sequence. The faint, red M-type stars in the bottom right of the H—R diagram are only about 1/10 the size of the Sun, whereas the bright, blue O-type stars in the upper left are about 10 times larger. The oblique dashed lines in Figure 17.14 represent stars having the same radii (so L
R2T4; Section 17.3) to estimate the radii (R) of main-sequence stars from their temperatures (T) and luminosities (L). They find that in order to account for the observed range in luminosities, stellar radii must also vary along the main sequence. The faint, red M-type stars in the bottom right of the H—R diagram are only about 1/10 the size of the Sun, whereas the bright, blue O-type stars in the upper left are about 10 times larger. The oblique dashed lines in Figure 17.14 represent stars having the same radii (so L ![]() T4 along these lines). By including such lines, we can indicate stellar temperatures, luminosities, and radii on a single plot.
T4 along these lines). By including such lines, we can indicate stellar temperatures, luminosities, and radii on a single plot.
We see a very clear trend as we traverse the main sequence from top to bottom. At one end, the stars are large, hot, and bright. Because of their size and color, they are referred to as blue giants. The very largest are called blue supergiants. At the other end, stars are small, cool, and faint. They are known as red dwarfs. Our Sun lies right in the middle.
Figure 17.15 shows an H—R diagram for a different group of stars—the 100 stars of known distance having the greatest apparent brightness, as seen from Earth. Notice the much larger number of very luminous stars at the upper end of the main sequence than at the lower end in Figure 17.15. The reason for this excess of blue giants is simple—we can see very luminous stars a long way off. The stars shown in Figure 17.15 are scattered through a much greater volume of space than those in Figure 17.14, but the sample is heavily biased toward the brightest objects. In fact, of the 20 brightest stars in the sky, only 6 lie within 10 pc of us; the rest are visible, despite their great distances, because of their high luminosities.
If very luminous blue giants are overrepresented in Figure 17.15, then low-luminosity red dwarfs are surely underrepresented. In fact, no dwarfs appear on that diagram. This absence is not surprising, because such low-luminosity stars are very difficult to observe from Earth. They are just too faint, and they radiate much of their energy in the invisible, infrared part of the electromagnetic spectrum. However, in the 1970s, astronomers began to realize that they had greatly underestimated the number of red dwarfs in the Galaxy. As hinted at by the H—R diagram in Figure 17.14, which shows an unbiased sample of stars in the solar neighborhood, red dwarfs are actually the most common type of star in the sky. They probably account for upward of 80 percent of all stars in the universe.
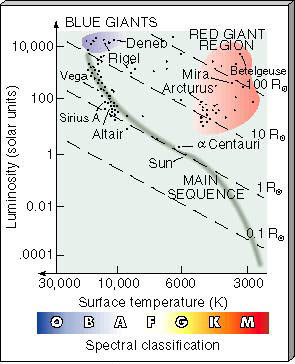
Figure 17.15 An H—R diagram for the 100 brightest stars in the sky. Such a plot is biased in favor of the most luminous stars—which appear toward the upper left—because we can see them more easily than we can the faintest stars. (Compare this with Figure 17.14, which shows only the closest stars.)
Most stars lie on the main sequence. However, some of the points plotted in Figures 17.13—17.15 clearly do not. One such point in Figure 17.13 represents Sirius B, a white dwarf whose surface temperature (24,000-K) is about four times that of the Sun and whose luminosity is about 0.04 times the solar value. A few more such faint A-type stars can be seen in Figure 17.14 in the bottom left-hand corner of the H—R diagram. This region, known as the white dwarf region, is marked on Figure 17.14.
Also shown in Figure 17.13 is Mira (Omicron Ceti), whose surface temperature (3000 K), is about half that of the Sun and whose luminosity is some 400 times greater than the Sun's. Another point represents Betelgeuse (Alpha Orionis), the ninth brightest star in the sky, a little cooler than Mira but more than 30 times brighter. The upper right-hand corner of the H—R diagram, where these stars plot (marked on Figure 17.15), is called the red giant region. No red giants are found within 5 pc of the Sun (Figure 17.14), but many of the brightest stars seen in the sky are in fact red giants (Figure 17.15). Red giants are relatively rare, but they are so bright that they are visible to very great distances. They form a third distinct class of stars in the H—R diagram, very different in their properties from both main-sequence stars and white dwarfs.
About 90 percent of all stars in our solar neighborhood, and probably a similar percentage elsewhere in the universe, are main-sequence stars. About 9 percent of stars are white dwarfs, and 1 percent are red giants.