Before the twentieth century, astronomers' conception of the cosmos differed markedly from the modern view. The fact that we live in just one of many enormous "islands" of matter separated by even larger tracts of apparently empty space was completely unknown, and the clear distinction between "our Galaxy" and "the universe" did not exist. The twin ideas that (1) the Sun is not at the center of the Galaxy and (2) the Galaxy is not at the center of the universe required both time and hard observational evidence before they gained widespread acceptance.
In the late eighteenth century, long before the distances to any stars were known, the English astronomer William Herschel tried to estimate the size and shape of our Galaxy simply by counting how many stars he could see in different directions in the sky. Assuming that all stars were of about equal brightness, he concluded that the Galaxy was a somewhat flattened, roughly disk-shaped collection of stars lying in the plane of the Milky Way, with the Sun at its center (Figure 23.4). Subsequent refinements to this approach led to essentially the same picture; early in the twentieth century some workers went so far as to estimate the dimensions of this "Galaxy" as about 10 kpc in diameter by 2 kpc thick.

Figure 23.4 Eighteenth-century English astronomer William Herschel constructed this "map" of the Galaxy by counting the numbers of stars he saw in different directions in the sky. He assumed that all stars were of roughly equal luminosity and, within the confines of the Galaxy, were uniformly distributed in space. Our Sun (marked by the large yellow dot) appears to lie near the center of the distribution, and the long axis of the diagram lies in the plane of the Galactic disk.
Today the Milky Way Galaxy is known to be several tens of kiloparsecs across, and the Sun lies far from the center. How could the older picture have been so flawed? The answer is that the earlier observations were made in the visible part of the electromagnetic spectrum, and astronomers failed to take into account the (then unknown) absorption of visible light by interstellar gas and dust. (Sec. 18.1) Only in the 1930s did astronomers begin to realize the true extent and importance of the interstellar medium.
Any objects in the Galactic disk that are more than a few kiloparsecs away from us are hidden from our view by the effects of interstellar absorption. The apparent falloff in the density of stars with distance in the plane of the Milky Way is thus not a real thinning of their numbers in space but simply a consequence of the murky environment in the Galactic disk. The long "fingers" in Herschel's map are directions in which the obscuration happens to be a little less severe than in others. However, because some obscuration occurs in all directions in the disk, the falloff is roughly similar no matter which way we look, and so the Sun appears to be more or less at the center. The horizontal extent of Figure 23.4 corresponds approximately to the span of the blue and white arrows in Figure 23.1.
In contrast, radiation coming to us from above or below the plane of the Galaxy, where there is less gas and dust along the line of sight, arrives on Earth relatively unscathed. There is still some patchy obscuration, but the Sun happens to lie in a location where the view out of the disk is largely unimpeded by nearby interstellar clouds.
We have just seen how astronomers' attempts to probe the Galactic disk by optical means are frustrated by the effects of the interstellar medium, whereas looking in other directions, out of the Milky Way plane, we can see to much greater distances. During the first quarter of the twentieth century, studies of the large-scale structure of our Galaxy focused on two particularly important classes of objects, both found mainly away from the Milky Way. The first are globular clusters, those tightly bound swarms of old, reddish stars we first met in Chapter 17. (Sec. 17.10) About 140 are now known. The second were known at the time as spiral nebulae. Examples are shown in Figures 23.2(a) and 23.3(a). We know them today as spiral galaxies, comparable in size to our own.
Early twentieth-century astronomers had no means of determining the distances to any of these objects. They are far too distant to have any observable parallax and, with the technology of the day, main-sequence stars (after the discovery of the main sequence in 1911) could not be clearly identified and measured. For these reasons neither of the techniques discussed in Chapter 17 was applicable. (Sec. 17.1)
(Sec. 17.8) As a result, even the most basic properties—size, mass, and stellar and interstellar content—of globular clusters and spiral nebulae were unknown. It was assumed that the globular clusters lay within our own Galaxy, which was thought at the time to be relatively small (using the size estimates, just mentioned). The locations of the spiral nebulae were much less clear.
Knowing the distance to an object is vitally important to understanding its true nature. As an example, consider again the Andromeda "nebula" (Figure 23.2). In the late nineteenth century, when improved telescopes and photographic techniques allowed astronomers to obtain images showing detail comparable to Figure 23.(a), the newly released photographs caused great excitement among astronomers, who thought they were seeing the formation of a star from a swirling gaseous disk! Comparing Figure 23.2(a) with the figures in Chapter 15 (see especially Figure 15.1b), we can perhaps understand how such a mistake could be made—if we believed we were looking at a relatively close, star-sized object. Far from demonstrating that Andromeda was distant and large, the new observations seemed to confirm that it was just a small part of our own Galaxy.
Further observations soon made it clear that Andromeda is not a star-forming region. Andromeda's parallax is too small to measure, indicating that it must be at least several hundred parsecs from Earth, and, even at 100 pc—which we now know is vastly less than Andromeda's true distance—an object the size of the solar nebula would be impossible to resolve and simply would not look like Figure 23.2(a). (For another, much more recent example of how distance measurements affect our theoretical understanding of observational data, see Section 22.3. )
During the first three decades of the twentieth century, both the size of our Galaxy and the distances to the spiral nebulae were hotly debated in astronomical circles. One school of thought maintained that the spiral nebulae were relatively small systems contained within our Galaxy. Other astronomers held that the spirals were much larger objects, lying far outside the Milky Way Galaxy and comparable to it in size. However, with no firm distance information, both arguments were quite inconclusive. Only with the discovery of a new distance-measurement technique—which we discuss next—was the issue finally settled in favor of the latter view. However, in the process, astronomers' conception of our own Galaxy changed radically and forever.
An important by-product of the laborious effort to catalog stars around the turn of the twentieth century was the systematic study of variable stars. These are stars whose luminosity changes with time—some quite erratically, others more regularly. Only a small fraction of stars fall into this category, but those that do are of great astronomical significance.
We encountered several examples of variable stars in earlier chapters. Often, the variability is the result of membership in a binary system. Eclipsing binaries, novae, and Type I supernovae are examples. Novae and supernovae collectively are called cataclysmic variables because of their sudden, large changes in brightness. In other instances, however, the variability is a basic trait of a star and is not dependent on its being a part of a binary system. We call such a star an intrinsic variable.
A particularly important class of intrinsic variables is the class known as pulsating variable stars,* which vary cyclically in luminosity in very characteristic ways. Two types of pulsating variable stars that have played central roles in revealing both the true extent of our Galaxy and the distances to our galactic neighbors are the RR Lyrae and Cepheid variables. Following long-standing astronomical practice, the names come from the first star of each class to be discovered—in this case the variable star labeled RR in the constellation Lyra and the variable star Delta Cephei, the fourth brightest star in the constellation Cepheus, respectively.
* (note that these stars have nothing whatsoever to do with pulsars.)
RR Lyrae and Cepheid variable stars are recognizable by the characteristic shapes of their light curves. RR Lyrae stars all pulsate in essentially similar ways (Figure 23.5a), with only small differences in period between one RR Lyrae variable and another. Observed periods range from about 0.5 to 1 day. Cepheid variables also pulsate in distinctive ways (the regular "sawtooth" pattern in Figure 23.5b), but different Cepheids can have very different pulsation periods, ranging from about 1 to 100 days. The period of any given RR Lyrae or Cepheid variable is, to high accuracy, the same from one cycle to the next. The key point is that pulsating variable stars can be recognized and identified just by observing the variations in the light they emit.
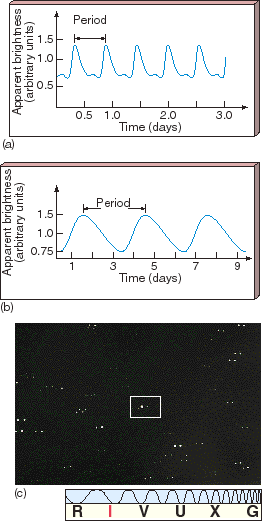
Figure 23.5 (a) Light curve of the pulsating variable star RR Lyrae. All RR Lyrae-type variables have essentially similar light curves, with periods of less than a day. (b) The light curve of a Cepheid variable star called WW Cygni, having a period of several days. (c) This Cepheid is shown here (boxed) on successive nights, near its maximum and minimum brightness; two photos, one from each night were superimposed and then slightly displaced.
Why do Cepheids and RR Lyrae variables pulsate? The basic mechanism was first suggested by the British astrophysicist Sir Arthur Eddington in 1941. The structure of any star is determined in large part by how easily radiation can travel from the core to the photosphere—that is, by the opacity of the interior, the degree to which the gas hinders the passage of light through it. If the opacity rises, the radiation becomes trapped, the internal pressure increases, and the star "puffs up." If the opacity falls, radiation can escape more easily, and the star shrinks. According to theory, under certain circumstances a star can become unbalanced and enter a state in which the flow of radiation causes the opacity first to rise—making the star expand, cool, and diminish in luminosity—and then to fall, leading to the pulsations we observe.
Thus, pulsating variable stars are normal stars experiencing a brief period of instability as a natural part of stellar evolution. The conditions necessary to cause pulsations are not found in main-sequence stars; they occur in evolved post—main-sequence stars as they pass through a region of the Hertzsprung—Russell diagram known as the instability strip (Figure 23.6). When a star's temperature and luminosity place it in this strip, the star becomes internally unstable, and both its temperature and its radius vary in a regular way, causing the pulsations we observe: as the star brightens, its surface becomes hotter and its radius shrinks; as its luminosity decreases, the star expands and cools. As we learned in Chapter 20, high-mass stars evolve across the upper part of the H—R diagram; when their evolutionary tracks take them into the instability strip, they become Cepheid variables. (Sec. 20.4) RR Lyrae variables are low-mass horizontal-branch stars that lie within the lower portion of the instability strip.
(Sec. 20.2)
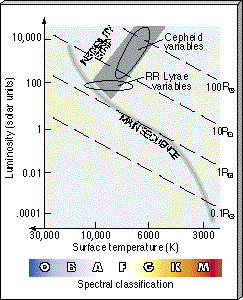
Figure 23.6 Pulsating variable stars are found in the instability strip of the H—R diagram. As a high-mass star evolves through the strip it becomes a Cepheid variable. Low-mass horizontal-branch stars in the instability strip are RR Lyrae variables.
The importance of these stars to Galactic astronomy lies in the fact that once we recognize a star as being of the RR Lyrae or Cepheid type, we can infer its luminosity, and that in turn allows us to measure its distance. The distance calculation is precisely the same as presented in Chapter 17 during our discussion of spectroscopic parallax. (Sec. 17.8) Comparing the star's (known) luminosity with its (observed) apparent brightness yields an estimate of its distance, by the inverse-square law:
(Sec. 17.4)
In this way astronomers can use pulsating variables as a means of determining distances, both within our own Galaxy and far beyond.
How do we infer a variable star's luminosity? For RR Lyrae stars, this is simple. All such stars have basically the same luminosity (averaged over a complete pulsation cycle)—about 100 times that of the Sun—so once a variable star is recognized as being of the RR Lyrae type, its luminosity is immediately known. For Cepheids, we make use of a close correlation between average luminosity and pulsation period, discovered in 1908 by Henrietta Leavitt of Harvard University (see Interlude 23-1) and known simply as the period-luminosity relationship. Cepheids that vary slowly—that is, have long periods—have large luminosities; conversely, short-period Cepheids have low luminosities.
Figure 23.7 illustrates the period—luminosity relationship for Cepheids found within a thousand parsecs or so of Earth. Astronomers can plot such a diagram for relatively nearby stars because they can measure the distances using stellar or spectroscopic parallax. Once distances are known, the luminosities of those stars can be calculated. We know of no exceptions to the period—luminosity relationship, and it is consistent with theoretical calculations of pulsations in evolved stars. Consequently, we assume that it holds for all Cepheids, near and far. Thus, a simple measurement of a Cepheid variable's pulsation period immediately tells us its luminosity—we just read it off the plot in Figure 23.7. (The roughly constant luminosities of the RR Lyrae variables are also indicated in the figure.)
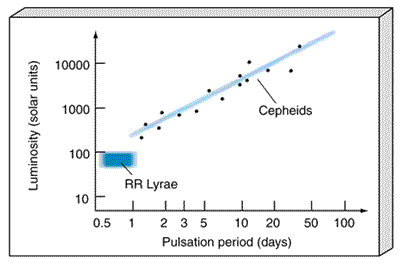
Figure 23.7 A plot of average absolute brightness (that is, luminosity) versus pulsation period for a group of Cepheid variable stars. The two properties are quite tightly correlated. The pulsation periods of some RR Lyrae variables are also shown.
This distance-measurement technique works well provided the variable star can be clearly identified and its pulsation period measured. With Cepheids, this method allows astronomers to estimate distances out to about 15 million parsecs, enough to take us all the way to the nearest galaxies. The less luminous RR Lyrae stars are not so easily seen as Cepheids, so their useful range is not as great. However, they are much more common so, within their limited range, they are actually more useful than Cepheids.
Figure 23.8 extends our cosmic distance ladder, begun in Chapter 2 with radar ranging in the solar system and expanded in Chapter 17 to include stellar and spectroscopic parallax, by adding variable stars as a fourth method of determining distance. Note that because the period—luminosity relationship is calibrated using nearby stars, this latest rung inherits any and all uncertainties and errors present in the lower levels. Uncertainties also arise from the "scatter" shown in Figure 23.7. Although the overall connection between period and luminosity is unmistakable, the individual data points do not quite lie on a straight line. Instead, a range of possible luminosities corresponds to any measured period.
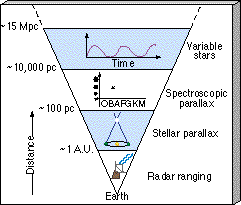
Figure 23.8 Application of the period—luminosity relationship for Cepheid variable stars allows us to determine distances out to about 15 Mpc with reasonable accuracy.
Many RR Lyrae variables are found in globular clusters. Early in the twentieth century the American astronomer Harlow Shapley used observations of RR Lyrae stars to make two very important discoveries about the Galactic globular cluster system. First, he showed that most globular clusters reside at great distances—many thousands of parsecs—from the Sun. Second, by measuring the direction and distance of each cluster, he was able to determine their three-dimensional distribution in space. In this way Shapley demonstrated
that the globular clusters map out a truly gigantic, and roughly spherical, volume of space, about 30 kpc across.* However, the center of the distribution lies nowhere near our Sun. It is located nearly 8 kpc away from us, in the direction of the constellation Sagittarius.
* (The Galactic globular cluster system and the Galactic halo of which it is a part are somewhat flattened in the direction perpendicular to the disk, but the degree of flattening is quite uncertain. The halo is certainly much less flattened than the disk, however.)
In a brilliant intellectual leap, Shapley realized that the distribution of globular clusters maps out the true extent of stars in the Milky Way Galaxy—the region that we now call the Galactic halo. (Since Shapley's time astronomers have identified many individual halo stars that do not belong to any globular cluster.) The hub of this vast collection of matter, 8 kpc from the Sun, is the Galactic center. As illustrated in Figure 23.9, we live in the suburbs of this huge ensemble, in the Galactic disk—the thin sheet of young stars, gas, and dust that cuts through the center of the halo.
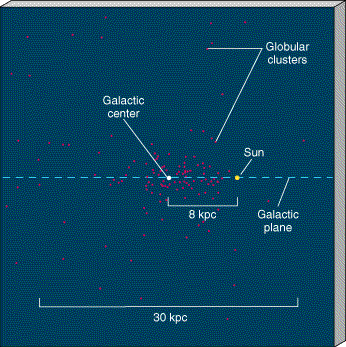
Figure 23.9 Our Sun does not coincide with the center of the very large collection of globular clusters. Instead, more globular clusters are found in one direction than in any other. The Sun resides closer to the edge of the collection, which measures roughly 30 kpc across. We now know that the globular clusters outline the true distribution of stars in the Galactic halo.
Shapley's bold interpretation of the globular clusters as defining the overall distribution of stars in our Galaxy was an enormous step forward in human understanding of our place in the universe. Five hundred years ago, Earth was considered the center of all things. Copernicus argued otherwise, demoting our planet to an undistinguished place removed from the center of the solar system. In Shapley's time, as we have just seen, the prevailing view was that our Sun was the center not only of the Galaxy but also of the universe. Shapley showed otherwise. With his observations of globular clusters he simultaneously increased the size of our Galaxy by almost a factor of 10 over earlier estimates and banished our parent Sun to its periphery, virtually overnight!
Curiously, Shapley's dramatic revision of the size of the Milky Way Galaxy and our place in it only strengthened his erroneous opinion that the spiral nebulae were part of our Galaxy and that our Galaxy was essentially the entire universe. He regarded as beyond belief the idea that there could be other structures as large as our Galaxy. Only in the late 1920s was the Copernican principle extended to the Galaxy itself, when American astronomer Edwin Hubble observed Cepheids in the Andromeda Galaxy and finally succeeded in measuring its distance.