Now that we have seen some of their basic properties, let us ask how galaxies are spread through the expanse of the universe beyond the Milky Way Galaxy. Are they scattered everywhere throughout intergalactic space all the way out to the very limits of the observable universe, or is there a boundary beyond which galaxies no longer exist? To begin to answer this question, we must first know the distances to the galaxies.
 Astronomers estimate that some 40 billion galaxies exist in the observable universe. Some reside close enough for the Cepheid variable technique to work—astronomers have detected and measured the periods of Cepheids in galaxies as far away as 15 Mpc (see Figure 24.10).
  (Sec. 23.2) However, most known galaxies lie much farther away. Cepheid variable stars in very distant galaxies simply cannot be observed well enough, even through the world's most sensitive telescopes, to allow us to measure their luminosity and period. To extend our distance-measurement ladder, therefore, we must find some new object to study. What individual objects are bright enough for us to observe at great distances?
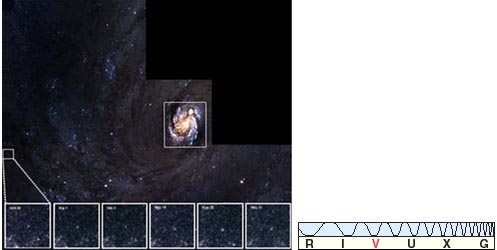
Figure 24.10 This sequence of six snapshots chronicles the periodic changes in a Cepheid variable star in the spiral galaxy M100, a member of the Virgo Cluster of galaxies. The Cepheid appears at the center of each inset, taken at the different times indicated in 1994. The star looks like a square because of the high magnification by the digital CCD camera—we are seeing individual pixels of the image. The 24th-magnitude star varies by about a factor of 2 in brightness every 7 weeks. (Compare with the image of M100 in Interlude 5-1.)
One way in which researchers have tackled this problem is through observations of standard candles—easily recognizable astronomical objects whose luminosities are confidently known. The basic idea is very simple. Once an object is identified as a standard candle—by its appearance or by the shape of its light curve, say—its luminosity can be estimated. Comparison of this luminosity with the object's apparent brightness then yields the object's distance and hence the distance to the galaxy in which it resides. Note that the Cepheid variable technique relies on identical reasoning; however, the term standard candle tends to be applied only to very bright objects. To be most useful, a standard candle must (1) have a narrowly defined luminosity, so that the uncertainty in estimating its brightness is small, and (2) be bright enough to be seen at large distances.
Over the years astronomers have explored the use of many types of objects as standard candles—novae, emission nebulae, planetary nebulae, globular clusters, Type I (carbon-detonation) supernovae, even entire galaxies have been employed. Not all have been equally useful, however; some have larger intrinsic spreads in their luminosities than others, making them less useful for distance-measuring purposes. Planetary nebulae and Type I supernovae have proved particularly reliable. The latter have remarkably consistent peak luminosities and are bright enough to be seen and identified out to distances of hundreds of megaparsecs. The small luminosity spread of Type I supernovae is a direct consequence of the circumstances in which these violent events occur. As discussed in Chapter 21, an accreting white dwarf explodes when it reaches a well-defined critical mass at which carbon fusion begins. (Sec. 21.3) The magnitude of the explosion is relatively insensitive to the details of how the white dwarf formed, or how it subsequently reached critical mass, with the result that all such supernovae have quite similar observational properties.*
* (Recall from Chapter 21 that a Type II supernova also occurs when a growing stellar core—this time at the center of a massive star—reaches a critical mass. (Sec. 21.2) However, the outward appearance of the explosion can be significantly modified by the amount of stellar material through which the blast wave must travel before it reaches the star's surface, resulting in a greater spread in observed luminosities.)
An important alternative to standard candles was discovered in the 1970s when astronomers found a close correlation between the rotational speeds and the luminosities of spiral galaxies within a few tens of megaparsecs of the Milky Way Galaxy. Rotation speed is a measure of a spiral galaxy's total mass, so it is perhaps not surprising that this property is related to luminosity. (Sec. 23.6) What is surprising is how tight the correlation is. The Tully-Fisher relation, as it is now known (after its discoverers), allows us to obtain a remarkably accurate estimate of a spiral galaxy's luminosity simply by observing how fast it rotates. As usual, comparing the galaxy's (known) luminosity with its (observed) apparent brightness yields its distance.
To see how the method is used, imagine we are looking edge-on at a distant spiral galaxy and observing one particular emission line, as illustrated in Figure 24.11. Radiation from the side of the galaxy where matter is generally approaching us is blueshifted by the Doppler effect. Radiation from the other side, which is receding from us, is redshifted by a similar amount. The overall effect is that line radiation from the galaxy is "smeared out," or broadened, by the galaxy's rotation. The faster the rotation, the greater the amount of broadening. By measuring the amount of broadening, we can determine the galaxy's rotation speed. Once we know that, the Tully—Fisher relation tells us the galaxy's luminosity.

Figure 24.11 A galaxy's rotation causes some of the radiation it emits to be blueshifted and some to be redshifted (relative to what the emission would be from a nonrotating source). From a distance, when the radiation from the galaxy is combined into a single beam and analyzed spectroscopically, the redshifted and blueshifted components combine to produce a broadening of the galaxy's spectral lines. The amount of broadening is a direct measure of the rotation speed of the galaxy.
The particular line normally used in these studies actually lies in the radio part of the spectrum. It is the 21-cm line of cold, neutral hydrogen in the galactic disk. (Sec. 18.4) It is used in preference to optical lines because (1) optical radiation is strongly absorbed by dust in the disk under study and (2) the 21-cm line is normally very narrow, making the broadening easier to observe. In addition, astronomers often use infrared, rather than optical, luminosities to avoid absorption problems caused by dust, both in our own Galaxy and in others.
The Tully—Fisher relation can be used to measure distances to spiral galaxies out to about 200 Mpc, beyond which the line broadening becomes increasingly difficult to measure accurately. A somewhat similar connection exists for elliptical galaxies, linking the broadening of a galaxy's spectral lines (which, in the case of an elliptical, measures the average random velocity of the stars in the galaxy) and the galaxy's size. By measuring the broadening, astronomers can determine the galaxy's true size, which is then compared with the apparent size to give the distance. (Sec. 1.5) These methods bypass many of the standard candles just described and so provide independent means of determining distances to faraway objects.
Standard candles and the Tully—Fisher relation share the fifth rung of our cosmic distance ladder (Figure 24.12). Just as with the lower rungs, we calibrate the properties of these new techniques using distances measured by more local means. In this way, the distance-measurement process "bootstraps" itself to greater and greater distances. However, at the same time, the errors and uncertainties in each step accumulate, so the distances to the farthest objects are the least well known.
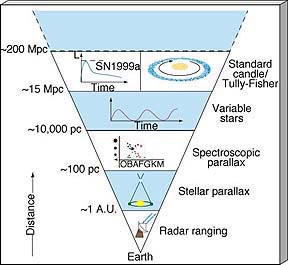
Figure 24.12 An inverted pyramid summarizes the distance techniques used to study different realms of the universe. The techniques shown in the bottom four layers—radar ranging, stellar parallax, spectroscopic parallax, and variable stars—take us as far as the nearest galaxies. To go farther, we must use new techniques, the method of standard candles and the Tully—Fisher relation, each based on distances determined by the four lowest techniques.
Figure 24.13 sketches the locations of all the known major astronomical objects within about 1 Mpc of the Milky Way Galaxy. Our Galaxy appears with its three known satellite galaxies—the two Magellanic Clouds and another recently discovered companion (still unnamed, but designated "Sagittarius" in the figure) lying almost within our own Galactic plane. The Andromeda Galaxy, lying 900 kpc from us, is also shown. Two galactic neighbors of Andromeda are shown in Figure 24.14; M33 is a spiral, and M32 is a dwarf elliptical, easily seen in Figure 23.2(a) to the bottom right of Andromeda's central bulge.
Figure 24.13 Diagram of the Local Group, made up of some 20 galaxies within approximately 1 Mpc of our Milky Way Galaxy. Only a few are spirals; most of the rest are dwarf elliptical or irregular galaxies. Spirals are shown in blue, ellipticals in pink, and irregulars in white.
Figure 24.14 Two well-known neighbors of the Andromeda Galaxy (M31): (a) the spiral galaxy M33 and (b) the dwarf elliptical galaxy M32 (also visible in Figure 23.2a, a larger-scale view of the Andromeda system).
All told, some 20 galaxies populate our Galaxy's neighborhood. Three of them (the Milky Way, Andromeda, and M33) are spirals; the remainder are dwarf irregular and ellipticals. Together, these galaxies form the Local Group—a new level of structure in the universe above the scale of our Galaxy. As indicated in Figure 24.13, the Local Group's diameter is roughly 1 Mpc. The Milky Way Galaxy and Andromeda are by far its largest members. The combined gravity of the galaxies in the Local Group binds them together, like stars in a star cluster, but on a millionfold larger scale. More generally, a group of galaxies held together by their mutual gravitational attraction is called a galaxy cluster.
Moving beyond the Local Group, we come to the next large concentration of galaxies, the Virgo Cluster (Figure 24.15). It lies about 18 Mpc from the Milky Way Galaxy. Like the Local Group, the Virgo Cluster is held together by the mutual gravitational attraction of its member systems. Unlike the Local Group, however, the Virgo Cluster does not contain a mere 20 galaxies. Instead, it houses approximately 2500 galaxies, each containing 100 billion or so individual stars. Those galaxies are bound together in a tightly knit group about 3 Mpc across. Figure 24.16 illustrates the approximate locations of Virgo and several other well-defined clusters in our cosmic neighborhood, lying within about 30 Mpc of the Milky Way Galaxy.
Figure 24.15 The central region of the Virgo Cluster of galaxies, about 18 Mpc from Earth. Several large spiral and elliptical galaxies can be seen. The galaxy near the center is a giant elliptical known as M86.
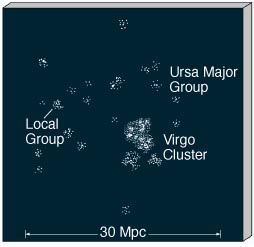
Figure 24.16 Schematic diagram of the location of several galaxy clusters in our part of the universe. Our Milky Way Galaxy is just one of these dots, and our Local Group just one of the clusters.
Many thousands of galaxy clusters have now been identified and cataloged, and they come in many shapes and sizes. Large, "rich" clusters, like Virgo, contain many thousands of individual galaxies distributed fairly smoothly in space. Small clusters, such as the Local Group, contain only a few galaxies and are quite irregular in shape. A small fraction of galaxies are not members of any cluster. They are apparently isolated systems, moving alone through intercluster space.
Does the universe have even greater groupings of matter, or do galaxy clusters top the cosmic hierarchy? Most astronomers believe that the galaxy clusters themselves are clustered, forming titanic agglomerations of matter known as superclusters.
Figure 24.17 shows the Local Supercluster, containing the Local Group, the Virgo Cluster, and most of the other clusters shown in Figure 24.16. (The direction of view is roughly perpendicular to that shown in the previous figure, so many of the clusters noted there are difficult to discern here.) Each point represents a galaxy, and the diagram is centered on the Milky Way Galaxy. The perspective is such that the disk of our Galaxy is seen edge-on and runs vertically up the page. The two nearly empty V-shaped regions at the top and bottom of the figure are not devoid of galaxies—they are simply obscured from view by the dust in our own Galaxy's plane. The total mass of the entire Local Supercluster is about 1015 solar masses. By now it should come as no surprise that the Local Group is not found at its heart, which lies within the Virgo Cluster. Instead, we live far off in the periphery, some 18 Mpc from the center.
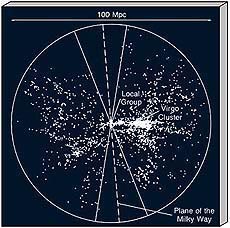
Figure 24.17 The Local Supercluster. Each of the 2200 points shown represents a galaxy, and the Milky Way Galaxy is at the center of the diagram. The Virgo Cluster and the plane of our own Galaxy are marked. Our Galaxy is seen edge-on. Its dust obscures our views to the top and the bottom, resulting in two empty V-shaped regions on the map.
The Local Supercluster contains a huge number of individual galaxies—several tens of thousands—yet the great majority of known galaxy clusters and superclusters lie far beyond its edge. Figure 24.18 is a long-exposure photograph of one such remote cluster. This rich cluster is far outside the limit of the circle shown in Figure 24.17. It is only one of many large and distant groups of galaxies scattered throughout the observable universe. The Coma Cluster, shown in Figure 24.1, is another. On and on, the picture is much the same. The farther we peer into deep space, the more galaxies, clusters of galaxies, and superclusters we see.
Figure 24.18 The galaxy cluster CL1358+62 contains huge numbers of galaxies and resides roughly a billion parsecs from Earth. Virtually every patch of light in this photograph is a separate galaxy. Thanks to the high resolution of the Hubble Space Telescope, we can now discern, even at this great distance, spiral structure in some of the galaxies. We also see many galaxies in collision—some tearing matter from one another, others merging into single systems.
Is there structure on even larger scales? As we will see in a moment, the answer is still yes. However, before we make our final leap in distance to the limits of the visible universe, let's pause for a moment to take stock of some important properties of galaxies and galaxy clusters and consider a few current ideas on how galaxies form and evolve.