Whittle : EXTRAGALACTIC ASTRONOMY


5. SPIRAL GALAXIES


(1) Introduction
(a) Spiral Galaxies are Complex Systems
Disk galaxies appear to be more complex than ellipticals
-
Wide range in morphological appearance:
eg classification bins : simple E0-6 compared with all the spiral types
not just smooth, considerable fine-scale details
-
Wide range in stellar populations:
old, intermediate, young and currently forming
 ongoing chemical enrichment
-
Wide range in stellar dynamics:
"cold" rotationally supported disk stars
"hot" mainly dispersion supported bulge and halo stars
-
Significant cold ISM:
note : the cold and warm components are dissipative, and
therefore :
influences dynamical evolution (eg helps spiral formation)
influences stellar density distribution (eg creates dense cores & black
holes)
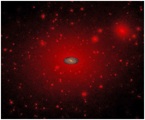
(b) Review of Basic Components [image]
-
Disks :
Metal rich stars and ISM
Nearly circular orbits with little (~5%) random motion & spiral patterns
Both thin and thick components
-
Bulge :
Metal poor to super-rich stars
High stellar densities with steep profile
V(rot)/ ~ 1, so dispersion support important.
-
Bar :
Flat, linear distribution of stars
Associated rings and spiral pattern
-
Nucleus :
Central (< 10pc) region of very high density (~106
M pc-3)
pc-3)
Dense ISM &/or starburst &/or star cluster
Massive black hole
-
Stellar Halo :
Very low SB; ~few % total light; little/no rotation
Metal poor stars; GCs, dwarfs; low-density hot gas
-
Dark Halo :
Dark matter dominates mass (and potential) outside ~10 kpc
Mildly flattened &/or triaxial

(2) 3-D Shapes
(a) Disks
(b) Bulges
Not as easy as ellipticals because of other components
Study edge-on spirals to minimise contamination
Results :
- oblate spheroids, flattened by rotation
probably similar to low-luminosity ellipticals
(c) Bars

- Axis ratios from 2.5 to 5.
- Probably flat, since they aren't visible in edge-on spirals
- However, "peanut" bulges thought to be thickened (unstable) bars seen edge-on [image]
(3) Surface Photometry
Model as two components: bulge and disk [image]
- 1-D fits to elliptically-azimuthally averaged light profile
- 2-D fits to full image: better, since bulge & disk have different ellipticities
(a) Radial Profiles
(b) Vertical Disk Structure
Studies of edge on disks suggests exponential distribution: [image]
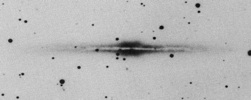
Where zo is the scale height of the disk, ie I(zo)
= I(0) / e
At large z, excess light sometimes reveals a second "Thick Disk" of larger z0
(see 4d(ii) below for further discussion of vertical disk structure)
(4) Disk Velocity Field
(a) Gas Rotation Curves
Typical rotation curve comprises [image]

- rise from zero at the nucleus
- Vmax peak at Rmax
- extended region close to flat
Many rotation curves have now been measured
Some systematic trends are noticable :
(i) At Large Radius
- Vmax increases as L increases (T-F relation, see below)
- Outer slope increases as L decreases [image]

for V(r)  R m we find
m in the range -0.2 to 0.2 (m = 0, flat, for MB ~ -22.5)
R m we find
m in the range -0.2 to 0.2 (m = 0, flat, for MB ~ -22.5)
Drop in massive early types caused, in part, by high Vmax from bulge
(ii) At Small Radius
(b) Stellar Velocities in the Disk
Disks are faint stellar LOSVD (Line Of Sight Velocity Dispersion) is difficult to measure
Also, brighter central regions are confused by bulge component
Nevertheless, some results are emerging.
(i) Rotation
For disk stars, Vlos >> los so stars are cold and have ~ circular orbits

Usually, Vstars follows Vgas which is close to Vc
[image]
- Sometimes, star orbital rotation velocity can be slower than the gas
this is called asymmetric drift and indicates a higher stellar dispersion
support beginning to be shared with dispersion
stars at r likely to be at apogee, so have V < Vc
- In S0s, ~30% have counter-rotating gas disks [image]
a few spirals even have two counter-rotating stellar disks
both indicate external origin postdating primary disk formation
(ii) Vertical Dispersion
Face-on galaxies yield z : the vertical stellar dispersion
- As a function of radius, z decreases exponentially, with scale length 2Rd
This agrees with simple stellar dynamics theory:
An isothermal disk gives z2 = 2  G zo
G zo  M
M
where M is the surface
mass density and zo is the scale height
Hence z
M½
I(r)½
exp(-R/2Rd), as found.
- Consider the Milky Way disk: observations near the solar neighborhood:
The inferred mass density within the disk suggests dark matter does not dominate the disk.
It turns out there are several components of different zo and
z [image]
- gas and dust, zo ~ 50 pc ;
z ~ 10 km/s
- young thin disk, zo ~ 200 pc ;
z ~ 25 km/s
- old thick disk, zo ~ 1.5 kpc ;
z ~ 50 km/s
The astrophysical origin of this is thought to be z increasing
with age
- stars born "cold" from molecular clouds with z ~ sound speed, and corresponding small z0
- stars gradually "heated" by scattering off DMCs and spiral arms, and/or
- heating of the disk over time by satellite passage and/or minor mergers
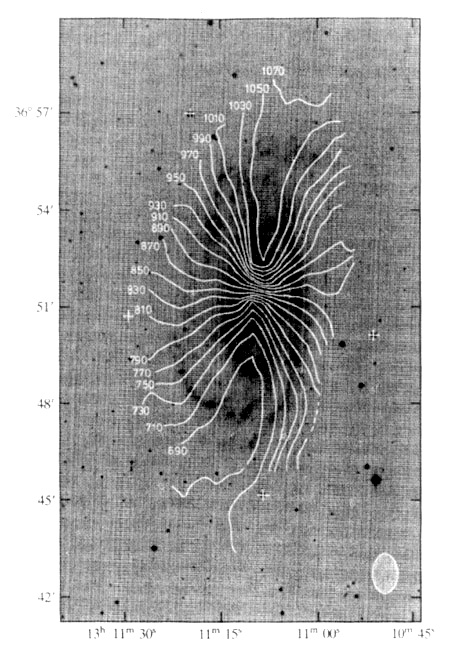
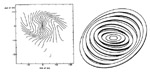
(c) 2-D Velocity Fields: Spider Diagrams
(5) Scaling Relations
There are a number of correlations between the global parameters of galaxies:
Luminosity; Size; Surface Brightness; Rotation Velocity;
Such relations are called "Scaling Relations".
They are important for several reasons:
They reveal the internal properties of galaxies
They must arise naturally in theories of galaxy formation.
In the case of disk galaxies, the most important is between Vrot and Luminosity:
(a) Vmax and the Tully-Fisher Relation
- Vmax = maximum rotation velocity (inclination corrected),
derived from: [image]
- Major axis optical (often H
 ) rotation curves (half the full amplitude)
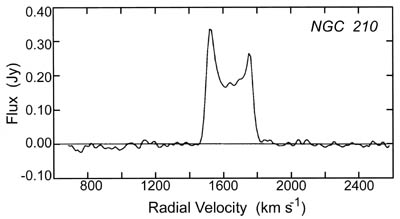
- HI 21 cm integrated (single dish) profile width, W20: W20 / sin i = 2Vmax
- Tully & Fisher (1977) recognised that Vmax correlates with galaxy luminosity
- As for the Faber-Jackson relation, the T-F relation stems from
virial equilibrium:
Vc2 M/R and L
I(0) R2
L
(M/L)-2 I(0)-1 Vc4
T-F relation holds if (M/L)-2 I(0)-1 ~ const
(roughly true)
- Usually, choose longer wavelengths (eg I & H bands rather than B & V): [image]
- smaller scatter on the T-F relation, and slightly steeper gradient ( larger)
This is because, at ~1-2µm :
- L1µ is less sensitive to star formation and dust
- L1µ tracks older population which dominates mass and has a more homogeneous M/L ratio
- The T-F relation is one of the key methods of distance determination
- First calibrate on nearby galaxies with Cepheid distances [image]
this yields the following relations :
- Then for more distant galaxies, measure V, inclination, and apparent magnitude:
Vmax and TF relation gives M, which gives m - M, which gives distance.
- These greater distances can now be used with redshifts to derive Ho
[image]
(6) Mass Estimates and Dark Matter Halos
(a) Deriving M(r) from Vc(r)
For centrifugally supported circular motion, Vc(r) yields the mass distributions.
In general (not assuming spherical symmetry):
where  is a
geometry factor 0.7 < < 1.2
is a
geometry factor 0.7 < < 1.2
Sphere:
= 1.0, Flattened :
~ 0.7
For an exponential, thin disk, one can show that :
Where In and Kn are modified Bessel functions of the first and second kind.
 This rotation curve has peak: Vmax at Rmax ~ 2.2 Rd [image]
for R > 3 Rmax Vc(R) falls ~
R-½ (Keplerian)
(b) Results from Optical Rotation Curves
(c) Results from HI mapping
- Fortunately, HI extends well beyond the optical disk
[image]
while H goes to
2-3 Rd (~0.75 R25), HI often goes to
> 5 Rd
- Vrot rarely declines; still flat or rising
well beyond the disk [image]
It is necessary to invoke an invisible halo
Since  = d + h and Vc2 = r d/dr, then:
Vc2 = Vd2 + Vh2
Use the observed rotation, Vc, and the (predicted) disk rotation, Vd, to
infer the halo contribution, Vh, and its potential.
- Typically, bulge + disk accounts for inner rotation curve
with reasonable M/LB ~ 3 - 5
If this is forced to fit the inner rotation, it is a called "maximum disk" model
Dark matter halo needed at larger radii, giving total M/LB ~ 30
~5 times more dark matter than normal matter in stars + gas
This is a lower limit since Vrot still constant/rising!
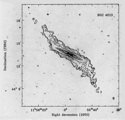
- Historically important paper: van Albada et al (1985) analysis of NGC 3198 : [image]
- It is now generally accepted that galaxies reside within large halos of dark matter.
[image]
(d) Dark Matter Halo Structure
- At largest measured radii Vrot is ~flat, so
 (r)
~ r-2 in this region
(r)
~ r-2 in this region
Unknown beyond this, but must drop faster to keep total mass finite.
- Difficult to constrain the inner parts
Bulge + "maximum disk" fits yield plausible M/L (~ 3-5), suggesting DM not important here
Halo contribution clearly drops at small radii, but functional form not well constrained.
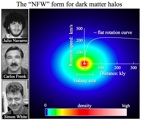
- N-body codes which follow hierarchical assembly of DM halos yield a particular form:
The Navarro-Frenk-White (NFW) 2-parameter broken power-law profile:
This has (r) ~ r-1 in the center and (r) ~ r-3 at r >> a.
Or a slightly better 3-parameter fit is the "Einasto Profile": [image]
In this case, dn  3n - 1/3 + 0.0079/n, ensures that re contains half the total mass.
n ~ 7 4, decreasing systematically with halo mass (cluster galaxy halos).
[See Merritt et al (2006 o-link) for a detailed discussion of halo fitting functions]
Both these give rotation curves that rise to a peak and slowly decline [image]
They are approximately flat in the regions measured by optical or HI rotation curves.
(e) Disk-Halo Conspiracy
There is an intriguing property of these rotation curves:
- After a rapid rise, most rotation curves are ~flat at all radii :
in regions where Vc is determined by disk matter, and
in regions where Vc is determined by dark matter
- How do these two different regions know they should have the
same rotation amplitude ??
- This is not currently understood, but indicates something
important about galaxy formation
- Notice that a related puzzle also underlies the Tully-Fisher relation
Vmax is set by the halo, while
MI is set by the luminous matter
- Indeed, the theoretical origin of the TF relation is not yet fully understood.
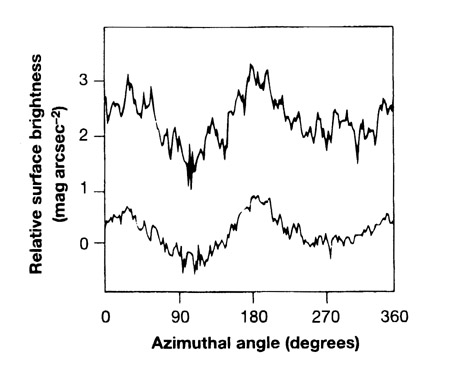
(7) Spiral and Bar Structures
(a) Spirals
(b) Bars
(8) Variation along the Hubble Sequence
We expect some properties to vary systematically
along the Hubble sequence (E
Sa Sc Im)
A detailed discussion is given by Roberts and Haynes : 1994, ARAA
[o-link]
from which these plots have been taken
[image],
[image],
[image].
Selection effects are very important, with different results for
flux & volume limited samples.
Roberts & Haynes use a sample of ~5000 RC3 galaxies with cz < 3000 km/s (Local Supercluster).
Three basic groups : Ellipticals, Spirals
(Sa - Scd), Dwarfs (Sd - Im) [S0 nature still debated]

 (
( ) > ~ 0.045)
 Ie, etc ]


 m
magnitudes (typically 1-2 in B), define A = dex(0.4
m
magnitudes (typically 1-2 in B), define A = dex(0.4 

 Defined as the angle between the tangents of arm and circle
 = Vc / R and Vc = constant we find